Introduction
The Annual Regional Analysis is a set of facts to inform community dialogue and district planning to address a central guiding question - What do families and communities need in terms of school options?
The purpose of the ARA is to support CPS’s goal of providing every student with high-quality education in every neighborhood by giving stakeholders a consistent array of information regarding school quality, enrollment patterns, school choice, and program offerings by region. The goal is to ensure that every student in Chicago has access to quality public schools and a variety of schools and programs.
The report includes information on all CPS schools, including traditional neighborhood, Selective Enrollment, Magnet, Charter, Special Education Specialty, and Options (alternative) high schools.
This document is a common fact base from which to understand the school landscape in communities. The intent of the ARA is not to provide recommendations but instead a set of findings based on district and regional data that serves as an input to inform community dialogue and district planning.
STRUCTURE & ORGANIZATION
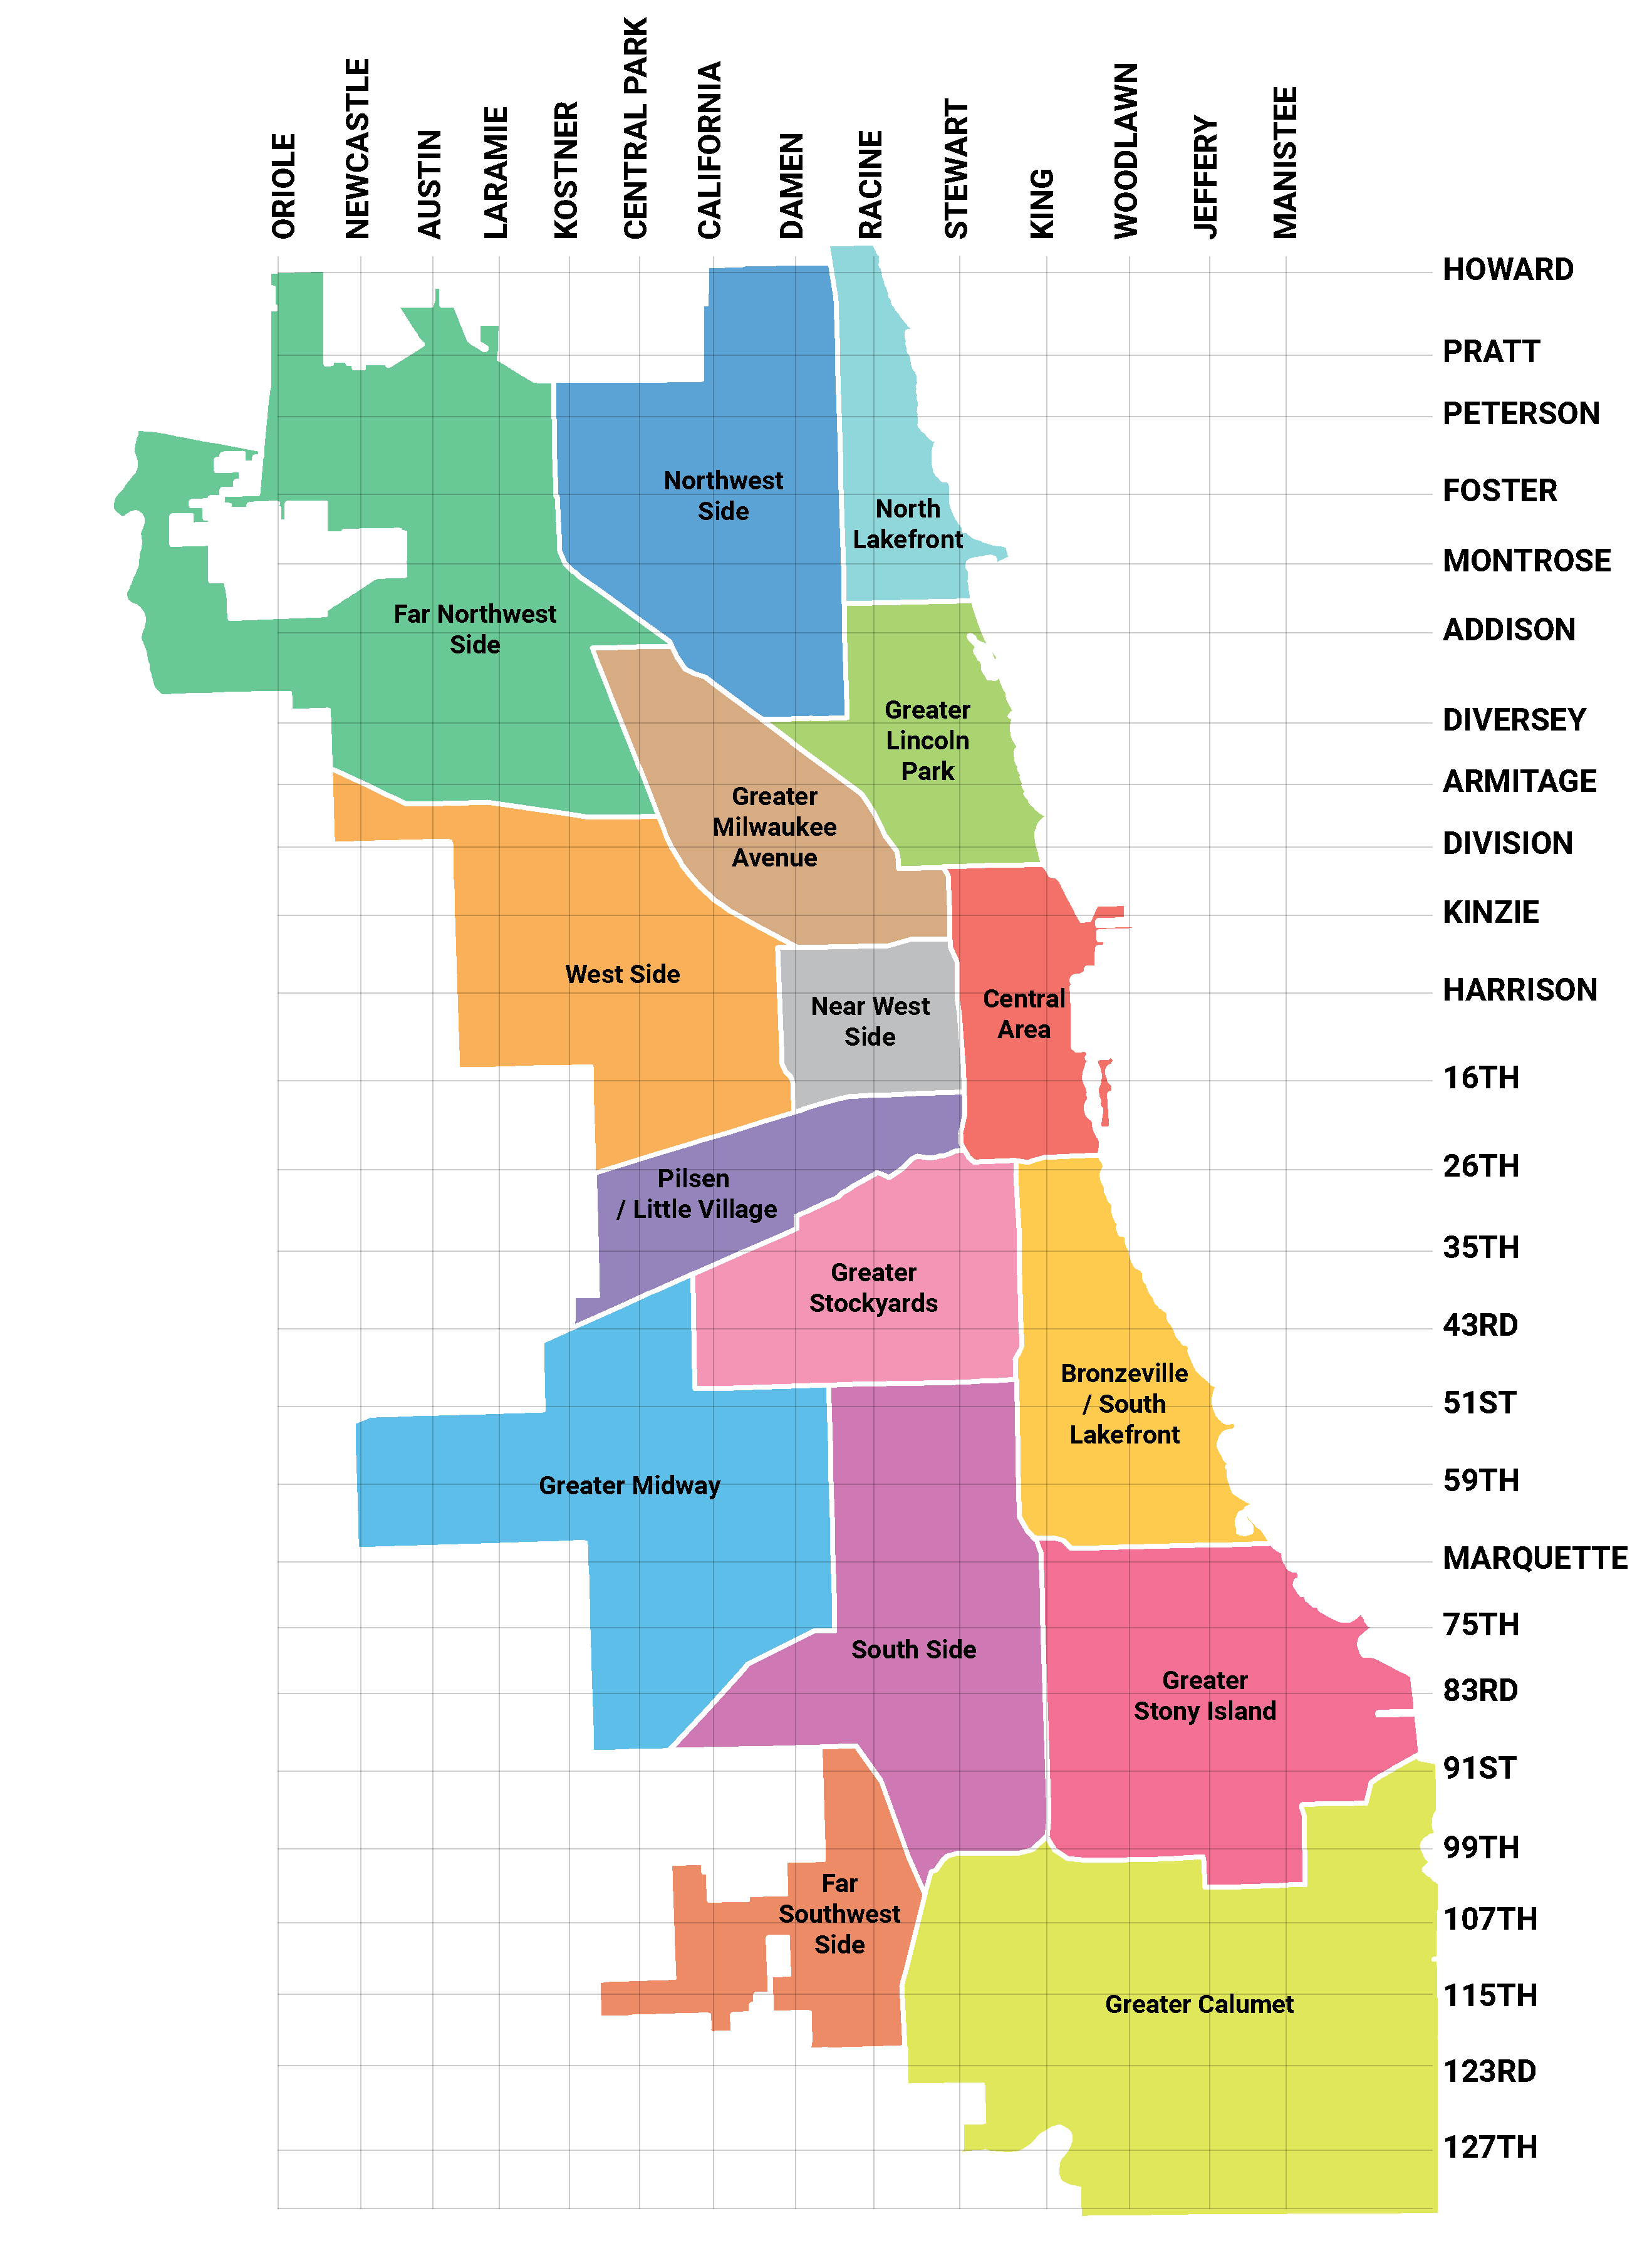
The ARA is organized by the 16 geographic regions designated within the Chicago Neighborhoods Now planning initiative. The regions were created by the City of Chicago's Department of Planning and Development based on research on housing and jobs. They are defined with natural boundaries, such as rivers and rail lines, in mind. These elements, as well as transportation options, are likely considerations for families in choosing schools. With the goal of utilizing a consistent structure year to year, these regions are more stable than city wards and school networks.
-
Explore this section to learn important background information about the region.
Overview
Explore this section to learn important background information about the region.
-
The West Side region’s boundaries are, generally, West Addison Street to the north, West Grand Avenue to the south, the Metra Union Pacific Northwest railroad line to the east, and the Metra District/North line to the west. It contains parts of 11 wards, 19 neighborhoods, and five community areas. It is served by 15 CTA train stops and 8 Metra stops.
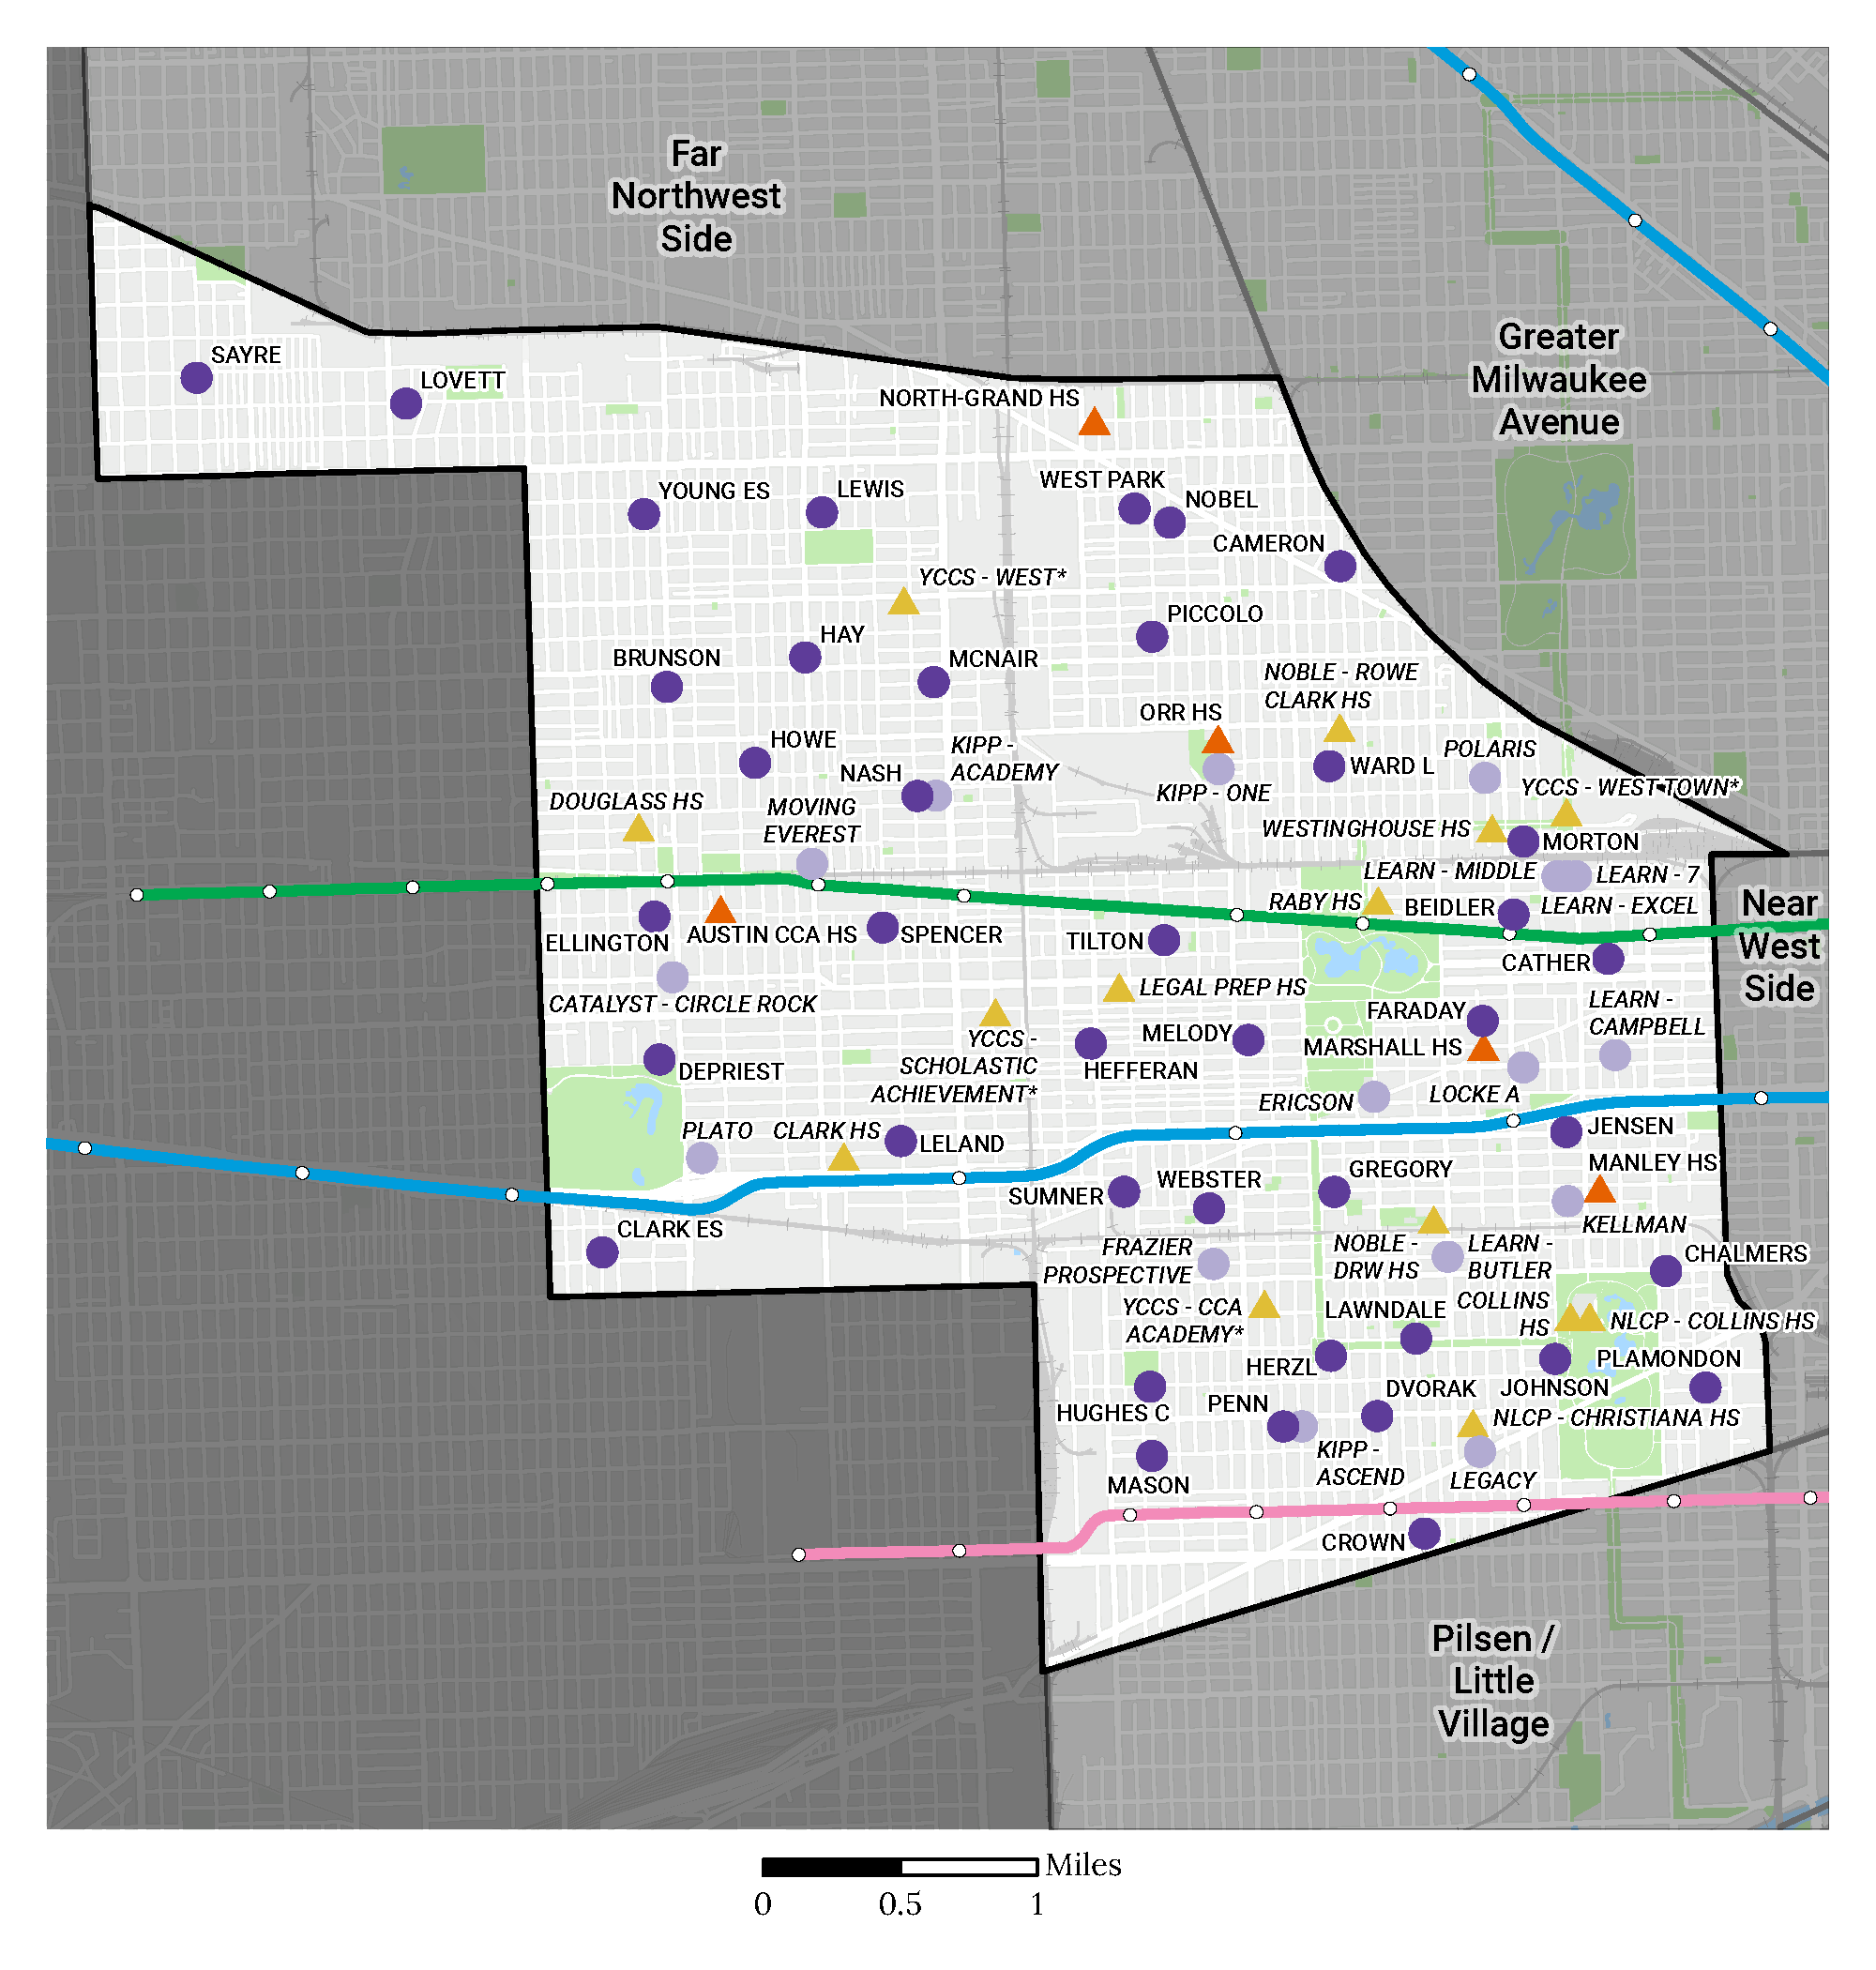
* Denotes Options/alternative or special education specialty school
School Type
Elementary Schools
AttendanceCitywideHigh Schools
AttendanceCitywide -
In the West Side region over the last four years, the number of students identifying as Black has decreased while the number of students identifying as Latinx has increased.
In the racial/ethnic composition of the West Side student population, the majority of students identify as Black, although in the past four years the percentage of students identifying as Black has decreased from 75% to 69% as the percentage of students identifying as Latinx has increased from 23% to 29%.
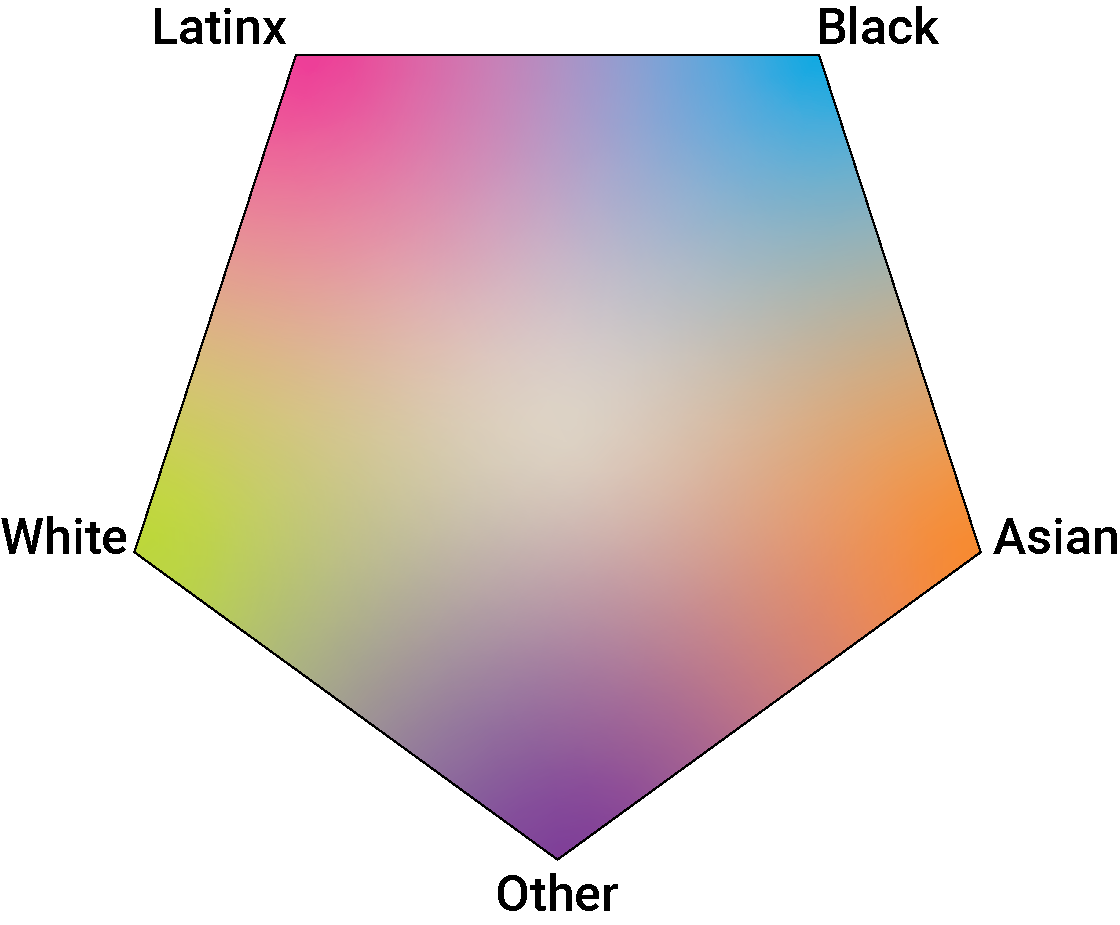
The majority of the students in the southern portion of the West Side region identify as Black, with the northeast portion being primarily students identifying as Latinx.
RACIAL/ETHNIC COMPOSITION OVER TIME
Race/Ethnicity
NOTE: The dots on this map are pie charts showing the mix of students residing in an area. It does not show information about individual students. The white spaces in the map are areas where no students live.
-
In the past four years, the percentage of students qualifying for Free and Reduced Lunch (FRL) has increased from 88% to 92%. The percentage of students qualifying for FRL in the region remains higher than the overall district percentage of 78%.
The West Side region is primarily made up of low-income neighborhoods. The northwest portion of the region is the higher-income Galewood area.1
FREE AND REDUCED LUNCH RATE OVER TIME
Median Household Income
 $39,000 to $50,2991Before 2015, CPS relied on the Nutrition Services department to administer, communicate, and collect the FRL forms. When the federal lunch program was expanded to all students, CPS needed to administer a separate “Fee Waiver Form” that replaced the FRL form. As fee waivers continue to be collected throughout the school year, the percentage of qualifying students increases. In ARAs prior to SY21, the FRL data presented was from the 20th day of school. In this year's ARA, the data was collected in March 2022 to reflect the most up-to-date information.
Quality
Explore this section to learn more about how schools are preparing students for graduation and life after high school.
-
Since 2013, CPS has used the School Quality Rating Policy (SQRP) to evaluate and publicly report on annual school performance. In 2020, CPS suspended the SQRP due to the impact of COVID-19. School quality ratings were not released for school year 2020-21 and again for 2021-22.
The Annual Regional Analysis has utilized school quality ratings to explore and present data on student and school performance across the district since the ARA was first released in 2017. The absence of updated ratings limits our ability to present comprehensive and comparable indicators of school quality. This year, CPS has opted not to present the portions of the Quality section that rely exclusively on SQRP data. Postsecondary indicators of student success have been included as they rely on data that has consistently and reliably been available over the last two years. This data, while an incomplete picture of student performance and school quality, presents a perspective on how CPS schools are preparing students for graduation and life after high school.
Lastly, CPS is currently engaging in an accountability redesign process to develop the district’s new School Quality Rating Policy. The goals of the redesigned SQRP are to:
- Provide a more complete picture of school performance and progress
- Improve the district's capacity to support schools
- Provide clear information to parents and the public
- Evaluate and report on district effectivenessWhen implemented, updated SQRP data will be made available in the ARA Quality section. For more information on the SQRP accountability redesign initiative, visit cps.edu/strategic-initiatives/accountability-redesign/.
How Has School Quality Led to Student Preparedness for Postsecondary Success?
-
While the School Quality Rating Policy (SQRP) was suspended for school years 2020-21 and 2021-22, some data on student outcomes is available as an indicator of how schools are preparing high school students for postsecondary success.
-
High School Graduation
In the 2020-21 school year, 75% of high school students residing in the West Side region graduated high school in four years. This is lower than the district average of 80%. However, in the last four years the West Side region graduation rate has increased from 69% in 2017-18, a 6 percentage point increase. The West Side and Far Southwest Side regions have had the largest increases in the rate of students graduating from high school in four years.
DISTRICT VS. REGION 4-YEAR HIGH SCHOOL GRADUATION RATE OVER TIME
NOTE: For more information about how the high school graduation rate is calculated, visit cps.edu/about/district-data/metrics/.
College Enrollment
For high school students who graduated in 2020 and were residing in the West Side region, 54% enrolled in college after graduation. This is lower than the district average of 62%.
Nationally, college enrollment and persistence has declined significantly in the last two years; impacted greatly by the COVID-19 global pandemic.
DISTRICT VS. REGION COLLEGE ENROLLMENT RATE OVER TIME
NOTE: The graduating class of 2020 is the most recent year that college enrollment data is available.
For more information about how the college enrollment rate is calculated, visit cps.edu/about/district-data/metrics/.College Persistence
For high school students who graduated in 2019 and were residing in the West Side region, 61% enrolled and persisted in college. This is lower than the district average of 72%.
Nationally, college enrollment and persistence has declined significantly in the last two years; impacted greatly by the COVID-19 global pandemic.
DISTRICT VS. REGION COLLEGE PERSISTENCE RATE OVER TIME
NOTE: The graduating class of 2019 is the most recent year that college persistence data is available.
For more information about how the college persistence rate is calculated, visit cps.edu/about/district-data/metrics/.
Quantity
Explore this section for information on the number of seats and enrollment patterns in the region.
How Many Seats Are There for the Student Population?
-
Student Population
Students who reside in region, including those who attend school out of region
The number of students who live in the West Side region has decreased by 2,868 students (7.5%) since 2018-19, which is less than the 8.6% citywide decline. The K-8th grade population has decreased by 8.2% (less than the 11.6% decrease in total CPS K-8th grade student enrollment) and the 9th-12th grade population has decreased by 1.3% (about the same as the 1.1% decrease in total CPS 9th-12th grade student enrollment).
REGION STUDENT POPULATION OVER TIME
NOTE: Enrollment data is from the annual 20th-day count (September 27th, 2021).
Enrollment across CPS continues to decline; impacted in part by the COVID-19 global pandemic.Student Enrollment
Students who attend school in region, including those who reside out of region
The number of students enrolled in the region has decreased by 3,437 students (11.3%), which is greater than the student population decline in the district. For the past four years, there have been consistently fewer students enrolled in the region than living in the region. K-8 enrollment in the region has decreased by 10.1% and 9-12 enrollment has decreased by 7.2%.
REGION STUDENT ENROLLMENT OVER TIME
-
There are 30,181 more seats than students enrolled in the region, including 20,983 elementary school seats and 9,198 high school seats.
Seats
Students
REGION SEATS VS. ENROLLMENT IN ELEMENTARY AND HIGH SCHOOLS
NOTE: Enrollment and seats figures listed here do not include Pre-K and Cluster students. The number of seats is the adjusted ideal capacity of the school building or the charter contract enrollment cap. Elementary grade students enrolled in combination K-12 schools are grouped into the high school category.
Enrollment across CPS continues to decline; impacted in part by the COVID-19 global pandemic.
How Many Pre-Kindergarten Seats Are There for the Student Population?
-
Total Pre-K Seats and Enrollment
In the West Side region, there are 2,253 Pre-K seats, 84% of which are in full-day programs and 16% in half-day programs.
TOTAL PRE-K SEATS IN THE REGION
In the West Side region, there were 1,210 students enrolled in Pre-K as of the 20th day of school (September 27th, 2021), 83% of which were in a full-day program. 82% of Pre-K students were 4-year-olds, while 18% were 3-year-olds. Pre-K students continue to enroll over the course of the school year.
TOTAL PRE-K ENROLLMENT IN THE REGION
There were 1,043 unfilled Pre-K seats in the West Side region as of the 20th day of school (September 27th), 891 of which were full-day seats. The full-day programs were 53% filled while the half-day programs were 58% filled. Pre-K enrollment continues to occur over the course of the school year.
TOTAL PRE-K ENROLLMENT VS. SEATS IN THE REGION
Full-Day Pre-K Seats and Enrollment
In the West Side region, there has been a decrease of 170 full-day seats over the past four years, a 8.3% decrease. The number of seats has remained the same since last school year.
FULL-DAY PRE-K SEATS IN THE REGION OVER TIME
NOTE: In 2020-21, the maximum number of filled Pre-K seats per classroom was lowered from 20 to 15 seats in order to maintain social distancing in Pre-K classrooms.
4-Year-Old Enrollment Over Time
In 2021-22, there was a 42.6% increase in enrollment (285 students) of 4-year-olds in full-day Pre-K programs in the West Side region. In 2020-21, the district experienced a sharp decline in Pre-K enrollment, consistent with a nationwide decrease in Pre-K enrollment.
4-YEAR-OLD ENROLLMENT IN THE REGION OVER TIME
NOTE: In 2020-21, the maximum number of filled Pre-K seats per classroom was lowered from 20 to 15 seats in order to maintain social distancing in Pre-K classrooms.
Pre-K Enrollment by Race/Ethnicity
Enrollment in Pre-K in the region mostly mirrors enrollment by race and ethnicity in Kindergarten. The proportion of Pre-K and Kindergarten students are similar for both students identifying as Black (81%) or Latinx (16%).
PRE-K AND KINDERGARTEN ENROLLMENT IN THE REGION BY RACE/ETHNICITY
Race/Ethnicity
Choice
Explore this section for information on school choice patterns and student commute distance and time.
Are Elementary Students Choosing Schools in Their Region?
-
Elementary School Student Choice Over Time
School choice is currently defined as choosing to attend a school that is not a student’s zoned (or assigned) school. Over the past four years, in this region, elementary students attending a non-zoned school (in or out of region) has increased from 61% to 66%. In the same time frame, students attending their zoned school has decreased from 39% to 33%.
Elementary school students attending a school in the West Side region (zoned or non-zoned) has decreased from 79% to 76%, while students attending school out of region has increased from 21% to 23%.
ELEMENTARY SCHOOL STUDENT CHOICE OVER TIME
NOTE: Only K-8 grade students are included in school choice calculations as Pre-K students are not zoned to a school. Due to rounding, some charts may not add up to 100%.
Elementary School Students Who Attend School Out of Region by Race/Ethnicity
Of the 5,298 elementary students who live in the region but attend school out of the region, the greatest overall number are students who identify as Black or Latinx. Students identifying as Black, however, attend school out of region at a lower rate (11%) than students who identify as any other race/ethnicity in the region.
ELEMENTARY SCHOOL STUDENTS WHO ATTEND SCHOOL OUT OF REGION BY RACE/ETHNICITY
NOTE: Due to rounding, some charts may not add up to 100%.
Elementary School Students Who Attend a Non-Zoned School In Region
Of the 22,865 elementary students residing in the region, 43% (9,937 students) attend a school in their region that is not their zoned school. Of those students, 59% attend Charter/Contract schools with the remainder attending mostly other zoned schools or Magnet schools in the region.
SCHOOL TYPE FOR ELEMENTARY SCHOOL STUDENTS ATTENDING A NON-ZONED SCHOOL IN REGION
Elementary School Students Who Attend a Non-Zoned School Out of Region
Of the 22,865 elementary students residing in the region, 23% (5,298 students) attend a school out of the region. Of those students, 48% attend other zoned schools with the remainder attending mostly Charter/Contract, Magnet, Selective Enrollment, or other citywide schools out of the region.
SCHOOL TYPE FOR ELEMENTARY SCHOOL STUDENTS ATTENDING A SCHOOL OUT OF REGION
Elementary School Student's Distance and Time Traveled to School if Not Attending Zoned School
66% of elementary students residing in the West Side region do not attend their zoned school. Of those students, 26% travel less than 1 mile for school and 31% travel 3 miles or more. 35% of students who do not attend their zoned school travel less than 15 minutes and 11% travel 45 minutes or more.
DISTANCE TRAVELED TO SCHOOL FOR ELEMENTARY SCHOOL STUDENTS NOT ATTENDING THEIR ZONED SCHOOL
Region average: 1.8 mi. District average*: 1.5 mi.
TIME TRAVELED TO SCHOOL FOR ELEMENTARY SCHOOL STUDENTS NOT ATTENDING THEIR ZONED SCHOOL
Region average: 18 min. District average*: 16 min.
NOTE: Distance traveled and commute time are calculated based on the student’s home address and the address of their school. Commute time was calculated using Google Maps travel time estimations using the shorter travel time between walking and public transit. The analysis takes into account school start times and chooses routes that minimize travel and wait time. Any wait time before a trip starts is not included but wait times due to transfers are included.
*Average distances and commute times in this analysis do not include students attending their zoned school.
Due to rounding, some charts may not add up to 100%.
Where are Elementary Students Choosing to Attend Outside Their Region?
-
This map illustrates the current choice footprint of K-8th graders residing in the West Side region but attending a school out of the region. The Far Northwest Side, Greater Milwaukee Avenue, and Near West Side regions are enrolling the greatest overall number of elementary students that reside in the West Side region but attend school out of the region.
ELEMENTARY SCHOOL CHOICE FOOTPRINT MAP
Are High School Students Choosing Schools in Their Region?
-
Percentage of 8th Grade Students in the Region Who Applied to High School
Since 2017-18, CPS has utilized the GoCPS platform to allow students to research and apply to all high schools and high school programs. Students are asked to rank in order of preference the schools and programs they are most interested in. Students are still guaranteed a seat in the general education program at their zoned high school and do not have to submit a GoCPS application for that program. For more information about GoCPS and the high school application process, visit go.cps.edu.
In the West Side region, 97% (2,531) 8th grade students applied to a variety of high school programs in Rounds 1 and 2 of the GoCPS application process.
PERCENTAGE OF 8TH GRADE STUDENTS IN THE REGION WHO APPLIED TO HIGH SCHOOL
Percentage of Students in the Region Who Received an Offer from One of Their Top 3 Choices
Of the 8th grade students residing in the West Side region who applied in Round 1, 91% received an offer to one of their top 3 choices of high school programs. This figure does not include selective enrollment high schools as those schools use a different ranking process in GoCPS.
PERCENTAGE OF STUDENTS IN THE REGION WHO RECEIVED AN OFFER FROM ONE OF THEIR TOP 3 CHOICES
NOTE: This analysis only includes 8th grade applicants who were enrolled on the 20th day of school in 2021-22. Due to rounding, some charts may not add up to 100%.
High School Student Choice Over Time
School choice is currently defined as attending a school that is not a student’s zoned (or assigned) school. Over the past four years in this region, high school students attending a non-zoned school (in or out of region) has remained relatively the same at 93%, while 7% of high school students attend their zoned school.
High school students attending a school in the West Side region (zoned or non-zoned) has decreased from 46% to 42%, while students attending school out of region has increased from 55% to 58%.
HIGH SCHOOL STUDENT CHOICE OVER TIME
NOTE: Due to rounding, some charts may not add up to 100%.
High School Students Who Attend School Out of Region by Race/Ethnicity
Of the 5,831 high school students who attend school out of the region, the greatest overall number are students who identify as Black or Latinx. 48% of students identifying as Black attend school out of their home region, compared to 79% of students identifying as Latinx.
HIGH SCHOOL STUDENTS WHO ATTEND SCHOOL OUT OF REGION BY RACE/ETHNICITY
High School Students Who Attend a Non-Zoned School In Region
Of the 9,987 high school students residing in the region, 35% (3,450 students) attend a school in their region that is not their zoned school. Of those students, 42% attend Charter/Contract schools with the remainder attending other zoned schools, Selective Enrollment, Magnet, or other citywide schools in the region.
SCHOOL TYPE FOR HIGH SCHOOL STUDENTS ATTENDING A NON-ZONED SCHOOL IN REGION
High School Students Who Attend a Non-Zoned School Out of Region
Of the 9,987 high school students residing in the region, 58% (5,831 students) attend a school out of the region. Of those students, 41% attend Charter/Contract schools with the remainder attending mostly other zoned schools, other citywide schools, Selective Enrollment, or Magnet schools out of the region.
SCHOOL TYPE FOR HIGH SCHOOL STUDENTS ATTENDING A SCHOOL OUT OF REGION
High School Student's Distance and Time Traveled to School if Not Attending Zoned School
93% of high school students residing in the West Side region do not attend their zoned school. Of those students, 49% travel less than 3 miles for school and 16% travel 6 miles or more. 51% of students who do not attend their zoned school travel less than 30 minutes and 20% travel 45 minutes or more.
DISTANCE TRAVELED TO SCHOOL FOR HIGH SCHOOL STUDENTS NOT ATTENDING THEIR ZONED SCHOOL
Region average: 3.5 mi. District average*: 3.3 mi.
TIME TRAVELED TO SCHOOL FOR HIGH SCHOOL STUDENTS NOT ATTENDING THEIR ZONED SCHOOL
Region average: 31 min. District average*: 30 min.
NOTE: Distance traveled and commute time are calculated based on the student’s home address and the address of their school. Commute time was calculated using Google Maps travel time estimations using the shorter travel time between walking and public transit. The analysis takes into account school start times and chooses routes that minimize travel and wait time. Any wait time before a trip starts is not included but wait times due to transfers are included.
*Average distances and commute times in this analysis do not include students attending their zoned school.
Due to rounding, some charts may not add up to 100%.
Where are High School Students Choosing to Attend Outside Their Region?
-
This map illustrates the current choice footprint of 9th-12th graders residing in the West Side region but attending a school out of the region. The Far Northwest Side, Greater Milwaukee Avenue, Near West Side, and Northwest Side regions are enrolling the greatest overall number of high school students that reside in the West Side region but attend school out of the region.
HIGH SCHOOL CHOICE FOOTPRINT MAP
Are Options Students Choosing Schools in Their Region?
-
Options High School Student Choice Over Time
Options high schools serve students who need a new pathway toward high school graduation. CPS schools offer additional supports and services for students who have been out of school and seek to return or who may need opportunities to earn credits in an accelerated program. Some of CPS’ campuses offer additional supports such as counseling and alternative schedules for students who may work during the traditional school day.
Options high schools exist in every region except the Greater Lincoln Park and Far Southwest Side regions. Options high schools do not have attendance zones or admission criteria although many serve only students 16 years and older. Students can choose to attend any Options high school within or outside of their home region. For this reason, Choice patterns tend to differ for Options students compared to elementary and other high school students.
Over the past four years, the percentage of West Side region Options high school students attending a school in the region has decreased from 52% to 47%. In the West Side region, Options high school students attend school out of region at a greater rate than elementary students but at a lesser rate than other high school students.
OPTIONS HIGH SCHOOL STUDENT CHOICE OVER TIME
NOTE: Due to rounding, some charts may not add up to 100%.
Options High School Student's Distance Traveled to School
The average Options high school student in the West Side region travels 3.6 miles to school, which is 0.4 miles less than the district average. 55% travel less than 3 miles and 15% travel 6 miles or more.
DISTANCE TRAVELED TO SCHOOL BY OPTIONS STUDENTS
Region average: 3.6 mi. District average: 4 mi.
NOTE: Distance traveled and commute time are calculated based on the student’s home address and the address of their school. Commute time was calculated using Google Maps travel time estimations using the shorter travel time between walking and public transit. The analysis takes into account school start times and chooses routes that minimize travel and wait time. Any wait time before a trip starts is not included but wait times due to transfers are included.
Due to rounding, some charts may not add up to 100%.
Options High School Student's Time Traveled to School
The average Options high school student in the West Side region travels for 29 minutes to school, which is 4 minutes less than the district average. 61% travel for less than 30 minutes and 15% travel 45 minutes or more.
TIME TRAVELED TO SCHOOL BY OPTIONS STUDENTS
Region average: 29 min. District average: 33 min.
NOTE: Distance traveled and commute time are calculated based on the student’s home address and the address of their school. Commute time was calculated using Google Maps travel time estimations using the shorter travel time between walking and public transit. The analysis takes into account school start times and chooses routes that minimize travel and wait time. Any wait time before a trip starts is not included but wait times due to transfers are included.
Due to rounding, some charts may not add up to 100%.
Where are Options High School Students Choosing to Attend Outside the Region?
-
This map illustrates the current choice footprint of 9th-12th Options high school students residing in the West Side region. The Central Area, Greater Milwaukee Avenue, Near West Side, Northwest Side, and Pilsen / Little Village regions are enrolling the greatest overall number of Options high school students that reside in the West Side region but attend school out of the region.
MAP OF OPTIONS HIGH SCHOOL LOCATIONS AND WHERE OPTIONS HIGH SCHOOL STUDENTS RESIDE AND ATTEND
OPTIONS HIGH SCHOOL STUDENTS
# of HS Students Residing in Region that attend an Options HS
Share of HS Students Residing in Region that attend an Options HS
Greater Stony Island 801 11% South Side 922 11% Bronzeville / South Lakefront 496 10% West Side 1,030 9% Greater Calumet 627 9% Near West Side 93 8% Far Southwest Side 89 7% Pilsen / Little Village 294 6% Greater Midway 820 5% Greater Stockyards 317 5% Greater Milwaukee Avenue 256 5% North Lakefront 125 4% Northwest Side 341 3% Far Northwest Side 436 3% Central Area 33 3% Greater Lincoln Park 48 2% District 6,782 6% NOTE: Share of Options high school students by region is provided to show the proportion of HS students that attend an Options high school compared to all HS students that reside in that region.
Options high school students can attend school in or out of region except for in the Far Southwest Side and Greater Lincoln Park regions which do not contain Options high schools.
Options high schools do not have attendance zones or admission criteria although many serve only students 16 years and older.
Variety
Explore this section to learn more about the variety of schools and program types available in the region.
Do Students Have Access to the Variety of Schools and Programs Offered?
-
Elementary Program Density Table
The Program Density Index measures the density of certain academic programs in each region. The index is calculated as the number of program seats per 100 age-eligible CPS students who reside in the region. This index can be used to compare program availability across regions. For more information about types of programs, visit https://cps.edu/Pages/AcademicProgramRFP.aspx.
The West Side region has a high density of elementary Science, Technology, Engineering, and Math (STEM) and Personalized Learning programs. There are some elementary International Baccalaureate (IB), Fine & Performing Arts, Dual Language, and World Language programs.1
PROGRAM DENSITY INDEX (NUMBER OF PROGRAM SEATS PER 100 STUDENTS)
1Programs listed do not have admissions criteria for enrollment.
2Data regarding the presence of programs in charter schools or the number of seats in programs at charter schools may be missing or incomplete.
3STEM elementary programs include STEM, STEAM, Math, Science, Engineering, and Technology magnet and magnet cluster programs. Schools may offer STEM programming outside of magnet schools/magnet cluster programs.
4Personalized Learning is a learner-driven instructional model that fosters 21st century skills by empowering every student to actively co-design their learning path, pace, and environment according to their individual needs, strengths, and interests. This data includes schools that are on the path to schoolwide adoption of this approach.
5Many schools offer arts programming outside of magnet schools/magnet cluster programs. Schools receive a Creative Schools Certification indicating the strength of their arts programming. More information can be found on each school’s profile page.
6Other includes: Humanities, Math/Science, Math/Science/Technology, Montessori, Montessori/Fine & Performing Arts, Scholastic, and World Language and International Studies schools and programs.NOTE: Several elementary schools are currently incubating programs that are not included in the figures above.
The following elementary schools will begin Dual Language programming next school year: Davis N (Greater Stockyards).
The following schools will begin Fine & Performing Arts programming next school year: Bright (Greater Calumet) and Nash (West Side).
The following elementary school is incubating or is a candidate for authorization for the IB Primary Years program: Kilmer (North Lakefront).
The following schools will begin STEAM programming next school year: Ruggles (Greater Stony Island) and West Park (West Side).
The following elementary schools will begin STEM programming next school year: Hernandez (Greater Midway).High School Program Density Table
The Program Density Index measures the density of certain academic programs in each region. The index is calculated as the number of program seats per 100 age-eligible CPS students who reside in the region. This index can be used to compare program availability across regions. For more information about types of programs, visit cps.edu/Pages/AcademicProgramRFP.aspx.
The West Side region has a high density of high school Career & Technical Education (CTE) and Science, Technology, Engineering, and Math (STEM) programs. There are some Military/Junior Reserve Officer Training Corps (JROTC), Selective Enrollment, Fine & Performing Arts, and Personalized Learning programs.1
PROGRAM DENSITY INDEX (NUMBER OF PROGRAM SEATS PER 100 STUDENTS)
1Selective Enrollment, Military, and IB programs have admissions criteria for enrollment.
2Data regarding the presence of programs in charter schools or the number of seats in programs at charter schools may be missing or incomplete.
3Many schools may offer STEM programming beyond those designated as Early College STEM schools.
4Personalized Learning is a learner-driven instructional model that fosters 21st century skills by empowering every student to actively co-design their learning path, pace, and environment according to their individual needs, strengths, and interests. This data includes schools that are on the path to schoolwide adoption of this approach.
5Many schools offer arts programming outside of these specific Fine and Performing Arts programs. Schools receive a Creative Schools Certification indicating the strength of their arts programming. More information can be found on each school’s profile page.
6Other includes: AVID, Dual Language, Journalism, Science, Three-Year HS, and World Language and International Studies schools and programs. -
Elementary Program Seats Table
NUMBER OF ELEMENTARY SCHOOL PROGRAM SEATS IN THE REGION
NOTE: Data regarding the presence of programs in charter schools or the number of seats in programs at charter schools may be missing or incomplete.
High School Program Seats Table
NUMBER OF HIGH SCHOOL PROGRAM SEATS IN THE REGION
NOTE: Data regarding the presence of programs in charter schools or the number of seats in programs at charter schools may be missing or incomplete.
-
Early College and Career Credential Achievement
Early College and Career Credential (ECCC) programs provide access and support for rigorous, college-level, hands-on, and career-focused courses and experiences. ECCC programs advance student postsecondary success through earned college credits or professional credentials and the exposure to soft skills needed to succeed in college, civic, life, and the 21st-century labor market.
There are 7 different ECCC programs available to CPS students, including:
- Advanced Placement (AP)
- Career & Technical Education (CTE)
- Dual Credit (DC)
- Dual Enrollment (DE)
- International Baccalaureate (IB)
- Junior Reserve Officer Training Corps (JROTC)
- Seal of Biliteracy (SSB)
CPS has set an ambitious goal that 60% of students will earn an Early College and Career Credential by the time they graduate and considers ECCC rates to be a measure of student preparedness for postsecondary success.
In 2020-21, 28% of students residing in the West Side region earned at least one ECCC compared to 46% of students across CPS. Of the 7 ECCC programs, students residing in the West Side region earned the most credentials in Advanced Placement (12.5% of students) and Dual Credit (8.4%) programs last school year.
ECCC ACHIEVEMENT RATE BY PROGRAM FOR STUDENTS RESIDING IN THE REGION
NOTE: Students can earn an ECCC in more than one program. Students earning more than one credential are counted in each program category.
To learn more about AP, visit www.cps.edu/academics/college-credit/ap-credit. To learn more about CTE, DC, and DE programs, visit www.cps.edu/about/departments/early-college-and-career-education-ecce. To learn more about IB, visit www.cps.edu/academics/college-credit/ib-credit. To learn more about JROTC, visit www.chicagojrotc.com. To learn more about SSB, visit www.cps.edu/academics/language-and-culture/seal-of-biliteracy.
Reference
-
Elementary Schools
Enrollment, Seats and Choice Data By School
NOTE: CPS calculates seats using a set of space utilization standards. For more information, visit https://www.cps.edu/services-and-supports/school-facilities/facility-standards/. The unfilled seats calculation does not include the effect of overenrolled schools.
Residing Attending (RA) refers to students who reside in the school’s attendance boundary and attend the school. Total residing (TR) refers to the total number of students who reside in the attendance boundary and attend any CPS school. RA/TR is a measure of whether students who reside in the attendance boundary of a zoned school attend that school. Citywide schools do not have an attendance boundary and are listed as N/A.
Penn is co-located with KIPP - Ascend. KIPP - One is co-located with Orr HS.
High Schools
Traditional High School Enrollment, and Choice Data By School
NOTE: CPS calculates seats using a set of space utilization standards. For more information, visit https://www.cps.edu/services-and-supports/school-facilities/facility-standards/. The unfilled seats calculation does not include the effect of overenrolled schools.
Residing Attending (RA) refers to students who reside in the school’s attendance boundary and attend the school. Total residing (TR) refers to the total number of students who reside in the attendance boundary and attend any CPS school. RA/TR is a measure of whether students who reside in the attendance boundary of a zoned school attend that school. Citywide schools do not have an attendance boundary and are listed as N/A.
Collins HS is co-located with North Lawndale College Prep - Collins HS. Orr HS is co-located with KIPP - One HS.
Options High School Enrollment Data By School
Elementary Programs
Program Type By Schools
NOTE: Data regarding the presence of programs in charter schools or the number of seats in programs at charter schools may be missing or incomplete.
High School Programs
NOTE: Data regarding the presence of programs in charter schools or the number of seats in programs at charter schools may be missing or incomplete.