Region Choice Overview
Number of Schools in the Region
Elementary Schools

High Schools

Options School

Elementary School Attendance Boundaries in the Region
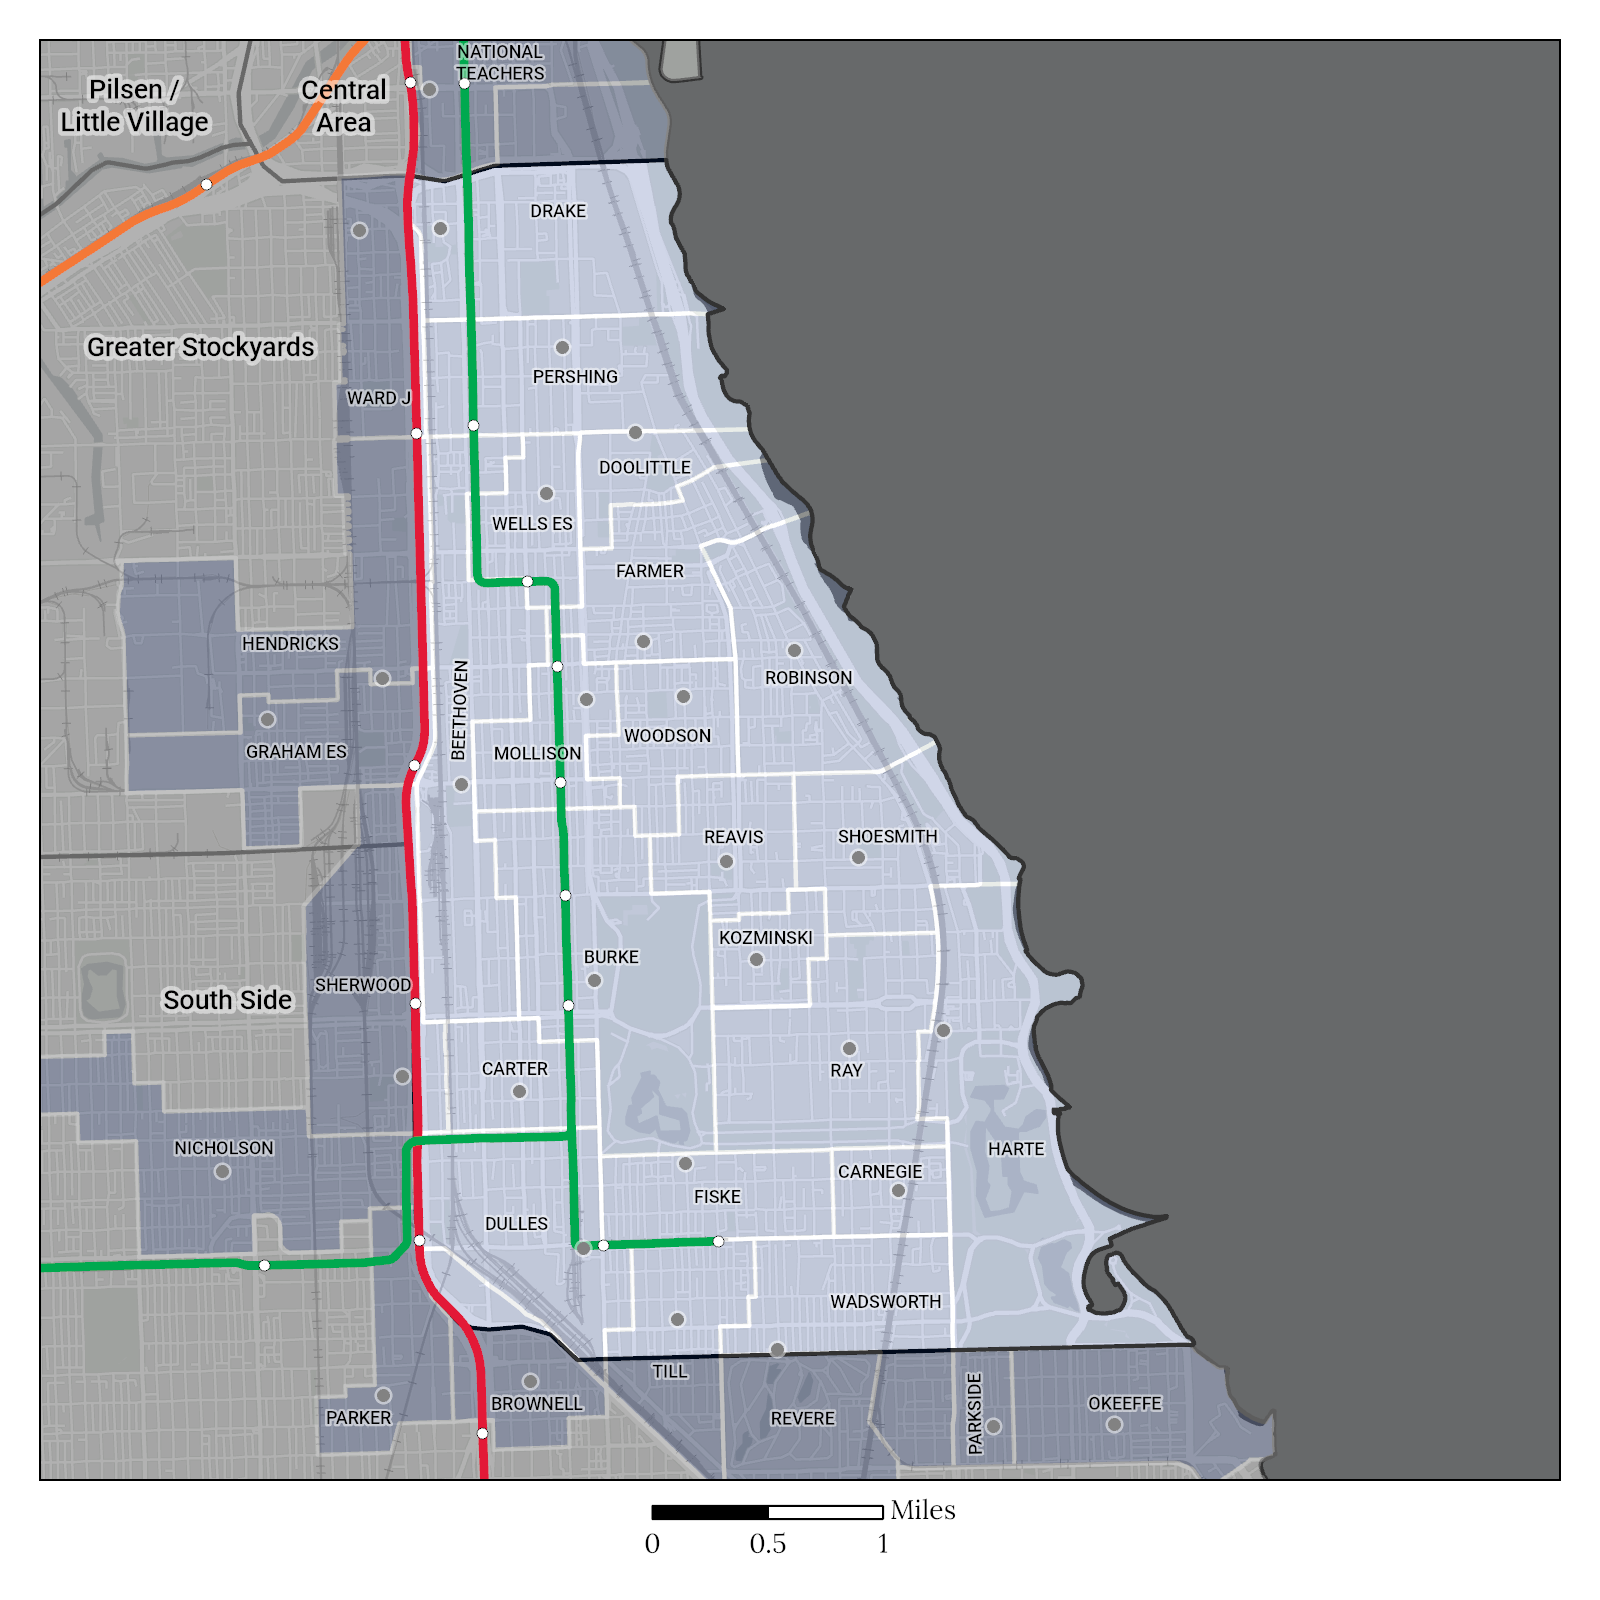
Elementary School Attendance Boundaries
NOTE: Schools in the region without attendance boundaries (citywide schools) are not shown on the attendance boundary map. Citywide schools do not have attendance boundaries and admit students through an application process.
CPS has some middle schools that serve a subset of grades K-8. Middle schools may have a dedicated attendance boundary. Only middle schools that are not co-located with a separate elementary school are included on this map. For more information on middle schools, use the CPS School Locator to understand which schools an address is zoned to.
High School Attendance Boundaries in the Region
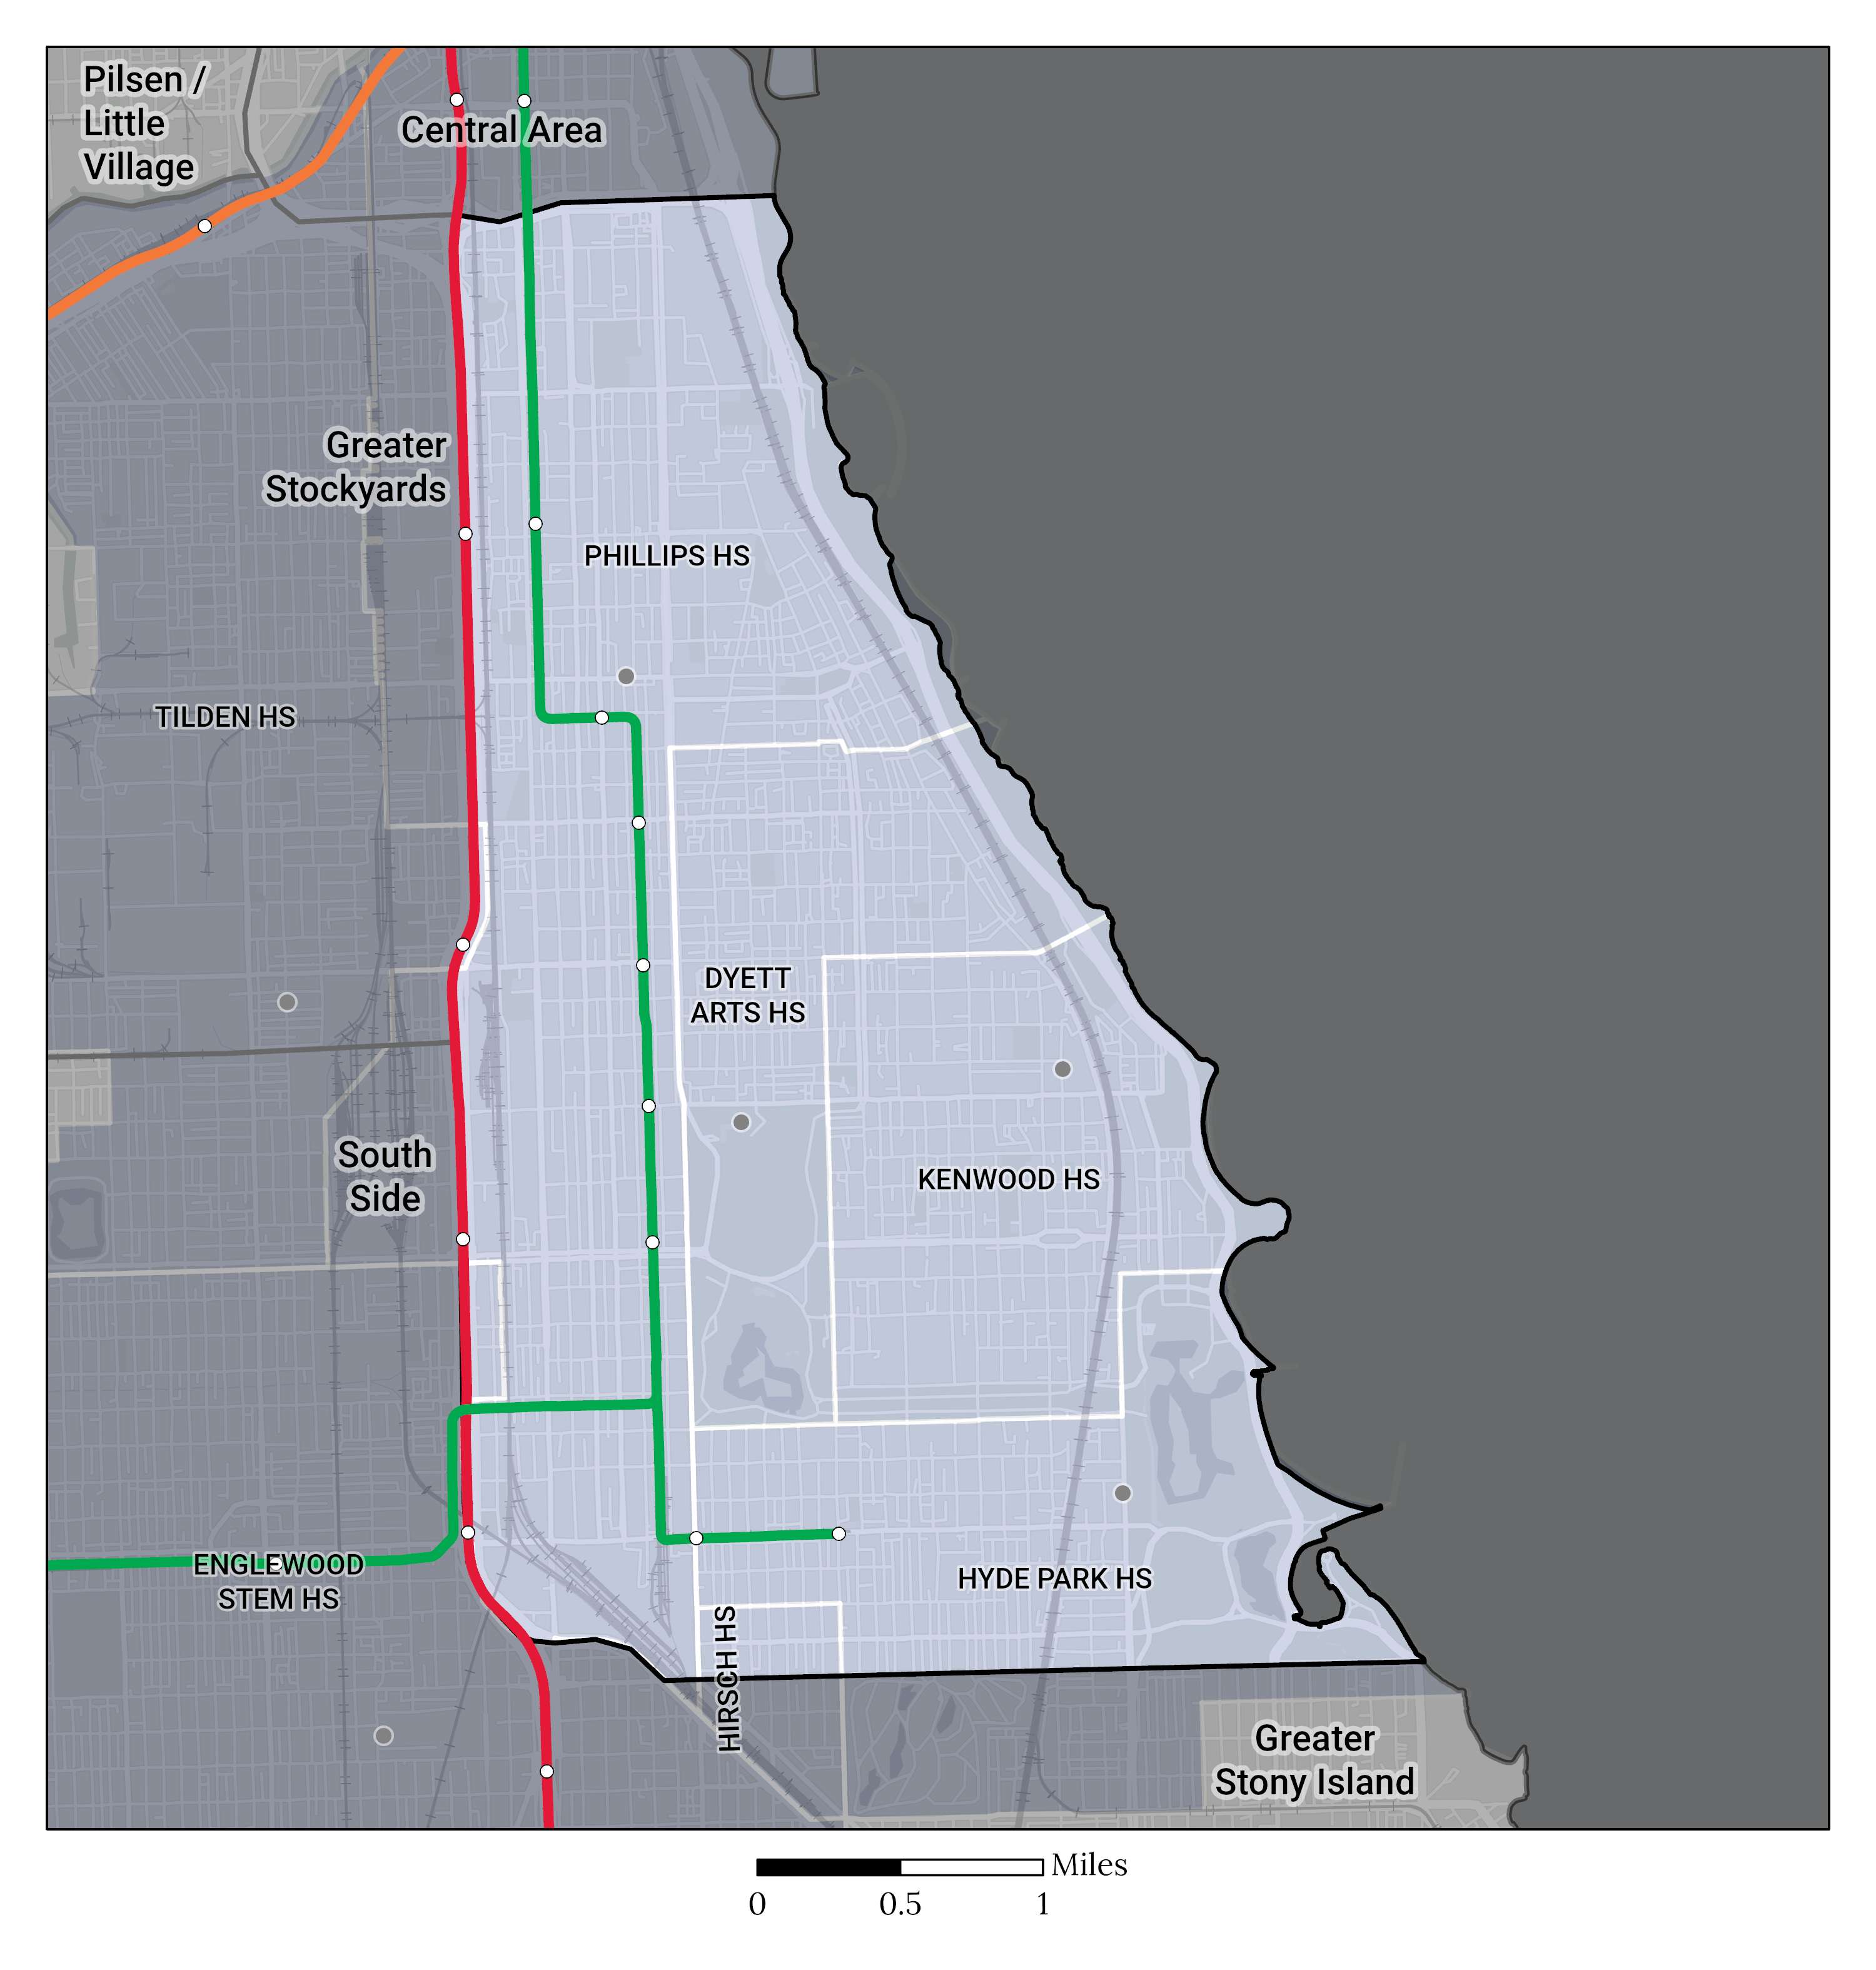
High School Attendance Boundaries
NOTE: Schools in the region without attendance boundaries (citywide schools) are not shown on the attendance boundary map. Citywide schools do not have attendance boundaries and admit students through an application process.
Options High Schools do not have attendance boundaries and students can choose to attend any Options high school within or outside of their home region.
Choice Patterns in the Region
Choice In
Students that live outside of the region and attend schools in the region
Choice Out
Students that live in the region but attend schools outside the region
Reside & Attend
Students that both reside and attend schools in the region
Enrollment by School Governance Type in the Region
NOTE: Alternative Learning Opportunities Programs (ALOP) are managed by external operators and offer self-paced, blended learning models with a half-day scheduling option that follows all CPS policies and procedures.
Are Elementary Students Choosing Schools in the Region?
Elementary School Student Choice Over Time
School choice is currently defined as choosing to attend a school that is not a student’s zoned (or assigned) school.
Over the past four years, in this region, the percent of elementary school students attending a school other than their zoned school (in or out of the region) has decreased from 60% to 59%. In the same time frame, the percentage of students attending their zoned school has increased from 40% to 41%.
The percentage of elementary school students attending a school in the Bronzeville / South Lakefront region (zoned or non-zoned) has remained relatively the same at 74%, while the percentage of students attending another school out of the region has remained relatively the same at 26%.
Elementary School Student Attendance Type Over Time
Elementary School Student Attendance Type Over Time
NOTE: Only K-8 grade students are included in school choice calculations as Pre-K students are not zoned to a school. Due to rounding, some charts may not add up to 100%.
Elementary School Students Who Attend School Out of Region by Race/Ethnicity
Of the 10,366 elementary students who live in the region, 26% (2,704 students) attend school outside of the region. Of those 2,704 students, 24% of students who identify as Black attend school outside of their home region compared to 34% of students who identify as Latinx and 45% of students who identify as Other.
Elementary School Students Attending School Out of Region by Race/Ethnicity
Elementary School Students Attending School Out of Region by Race/Ethnicity
NOTE: Due to rounding, some charts may not add up to 100%.
Elementary School Students Who Attend a Non-Zoned School In Region
Of the 10,366 elementary students residing in the region, 33% (3,403 students) attend another school in the region that is not their zoned school. Of those 3,403 students, 37% attend selective enrollment or choice programs with the remainder attending Charter/Contract schools, a zoned school other than their own, or other citywide schools in the region.
School Type of Elementary School Students Attending a Non-Zoned School In Region
School Type of Elementary School Students Attending a Non-Zoned School In Region
Elementary School Students Who Attend a Non-Zoned School Out of Region
Of the 10,366 elementary students residing in the region, 26% (2,704 students) attend another school out of the region. Of those 2,704 students, 34% attend selective enrollment or choice programs with the remainder attending a zoned school in another region, Charter/Contract schools, or other citywide schools out of the region.
School Type of Elementary School Students Attending a School Out of Region
School Type of Elementary School Students Attending a School Out of Region
Elementary School Student's Distance and Time Traveled to School
Of the 10,366 elementary students residing in the region, 55% travel less than 1 mile for school and 27% travel 3 miles or more. 49% of students travel less than 15 minutes and 12% travel 45 minutes or more.
Travel data can be helpful in understanding the overall choice patterns for the region. In general, shorter commutes can indicate that more or better school options are available within the region while longer commutes may mean that students are opting to travel greater distances to their school of choice.
Elementary School Students
Distance Traveled to School
Region median: 0.8 mi.
District median: 0.5 mi.
Elementary School Students
Time Traveled to School
Region median: 15 min.
District median: 12 min.
Elementary School Students Distance Traveled to School
Elementary School Students Time Traveled to School
NOTE: The travel distance and time medians represent the midpoint in each group of data. The midpoint is the point where 50% of students in the region travel shorter than this distance/time and 50% travel longer than this distance/time. Using a median more fairly represents travel data and reduces the influence of extreme values such as students who attend school very far away from their home region.
Distance traveled and commute time are calculated based on the student’s home address and the address of their school. Commute distance and time was calculated using Google Maps travel estimates and includes a combination of walking and public transit data. The analysis takes into account school start times and chooses routes that minimize unnecessary travel and wait time. Any wait time before a trip starts is not included but wait times due to transfers are included.
Due to rounding, some charts may not add up to 100%.
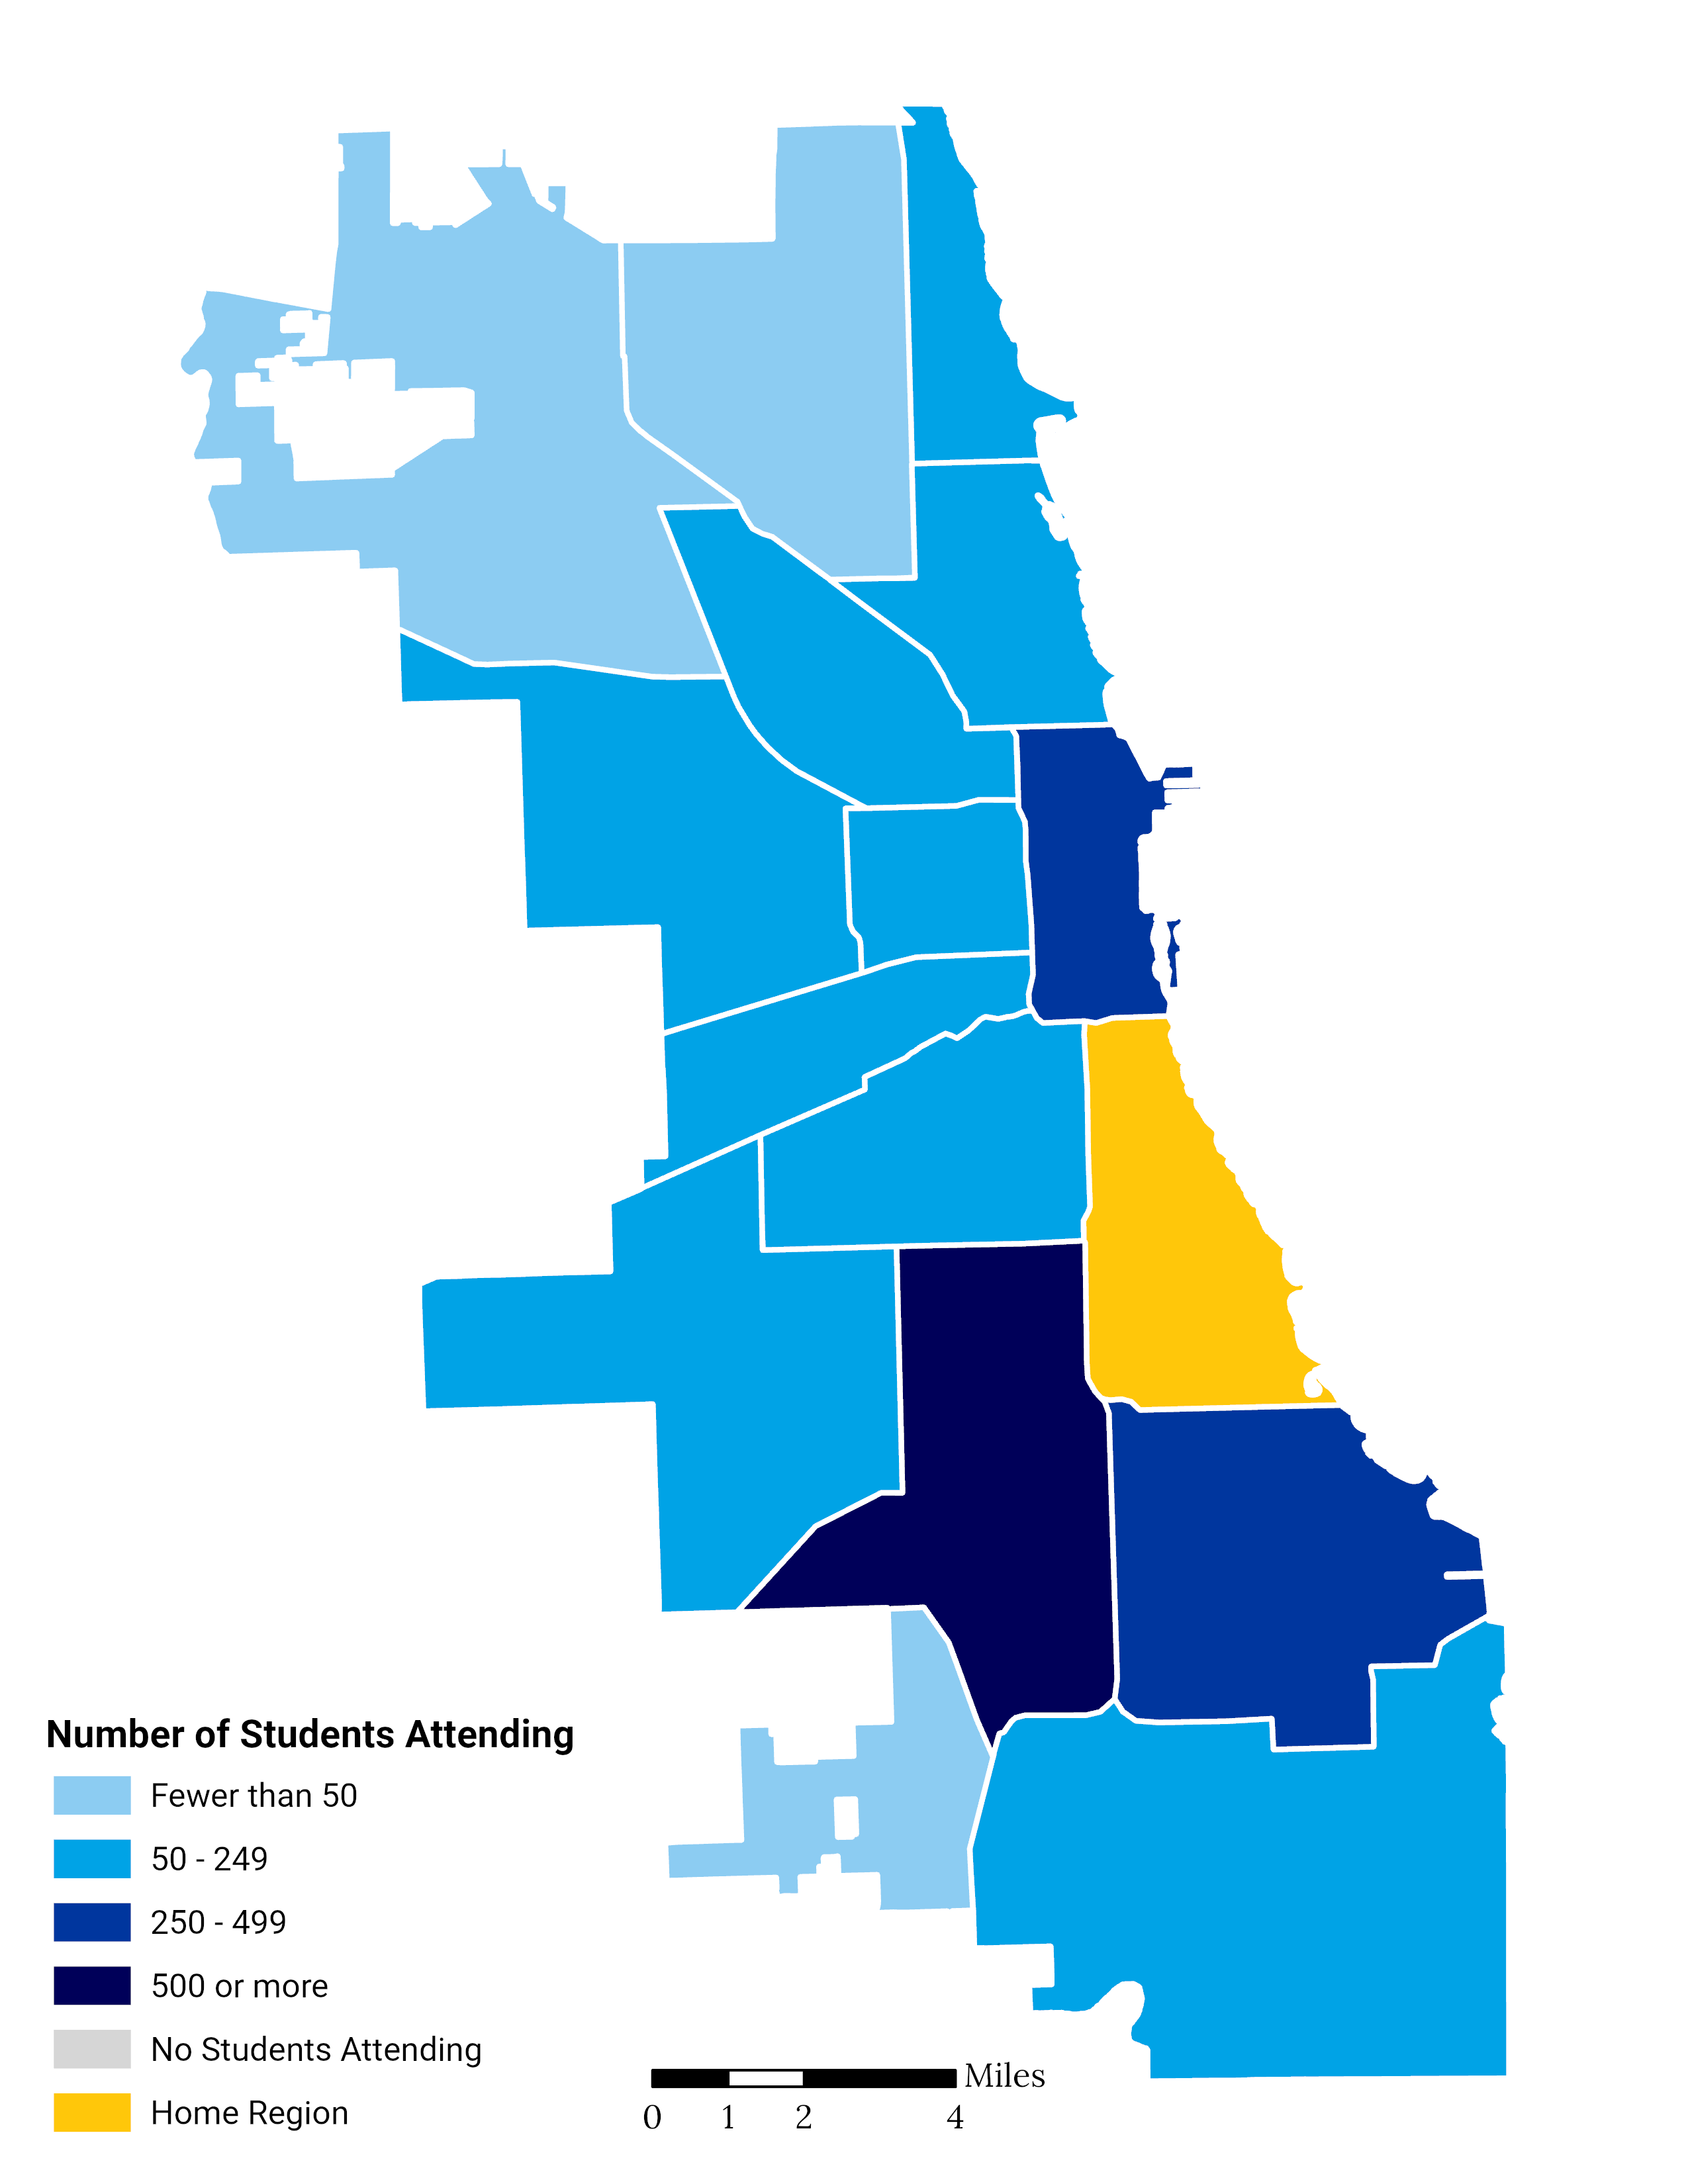
Where are Elementary Students Choosing to Attend Outside the Region?
This map illustrates the current choice footprint of K-8th graders residing in the Bronzeville / South Lakefront region but attending a school out of the region.
The South Side, Greater Stony Island, and Central Area regions are enrolling the greatest overall number of elementary students who reside in the Bronzeville / South Lakefront region but attend school out of the region.
Elementary School Choice Footprint Map
Are High School Students Choosing Schools in the Region?
High School Student Choice Over Time
School choice is currently defined as choosing to attend a school that is not a student’s zoned (or assigned) school.
Over the past four years, in this region, the percent of high school students attending a school other than their zoned school (in or out of the region) has decreased from 73% to 72%. In the same time frame, the percentage of students attending their zoned school has increased from 27% to 28%.
High school students attending a school in the Bronzeville / South Lakefront region (zoned or non-zoned) has increased from 61% to 62%, while students attending another school out of the region has decreased from 39% to 38%.
High School Student Attendance Type Over Time
High School Student Attendance Type Over Time
NOTE: Due to rounding, some charts may not add up to 100%.
High School Students Who Attend School Out of Region by Race/Ethnicity
Of the 4,690 high students who live in the region, 38% (1,787 students) attend school outside of the region. Of those 1,787 students, 37% of students who identify as Black attend school outside of their home region compared to 54% of students who identify as Latinx and 48% of students who identify as White.
High School Students Attending School Out of Region by Race/Ethnicity
High School Students Attending School Out of Region by Race/Ethnicity
NOTE: Due to rounding, some charts may not add up to 100%.
High School Students Who Attend a Non-Zoned School In Region
Of the 4,690 high students residing in the region, 34% (1,587 students) attend another school in the region that is not their zoned school. Of those 1,587 students, 45% attend selective enrollment or choice programs with the remainder attending Charter/Contract schools, a zoned school other than their own, or other citywide schools in the region.
School Type of High School Students Attending a Non-Zoned School In Region
School Type of High School Students Attending a Non-Zoned School In Region
High School Students Who Attend a Non-Zoned School Out of Region
Of the 4,690 high students residing in the region, 38% (1,787 students) attend another school out of the region. Of those 1,787 students, 46% attend Charter/Contract schools with the remainder attending selective enrollment or choice programs, other citywide schools, or a zoned school in another region.
School Type of High School Students Attending a School Out of Region
School Type of High School Students Attending a School Out of Region
High School Student's Distance and Time Traveled to School
Of the 4,690 high students residing in the region, 60% travel less than 3 miles for school and 19% travel 6 miles or more. 67% of students travel less than 30 minutes and 15% travel 45 minutes or more.
Travel data can be helpful in understanding the overall choice patterns for the region. In general, shorter commutes can indicate that more or better school options are available within the region while longer commutes may mean that students are opting to travel greater distances to their school of choice.
High School Students
Distance Traveled to School
Region median: 2.1 mi.
District median: 2.7 mi.
High School Students
Time Traveled to School
Region median: 22 min.
District median: 26 min.
High School Students Distance Traveled to School
High School Students Time Traveled to School
NOTE: The travel distance and time medians represent the midpoint in each group of data. The midpoint is the point where 50% of students in the region travel shorter than this distance/time and 50% travel longer than this distance/time. Using a median more fairly represents travel data and reduces the influence of extreme values such as students who attend school very far away from their home region.
Distance traveled and commute time are calculated based on the student’s home address and the address of their school. Commute distance and time was calculated using Google Maps travel estimates and includes a combination of walking and public transit data. The analysis takes into account school start times and chooses routes that minimize unnecessary travel and wait time. Any wait time before a trip starts is not included but wait times due to transfers are included.
Due to rounding, some charts may not add up to 100%.
Where are High School Students Choosing to Attend Outside the Region?
Choice Footprint Map
This map illustrates the current choice footprint of 9th-12th graders residing in the Bronzeville / South Lakefront region but attending a school out of the region.
The Central Area, South Side, and Greater Stony Island regions are enrolling the greatest overall number of high school students who reside in the Bronzeville / South Lakefront region but attend school out of the region.
High School Choice Footprint Map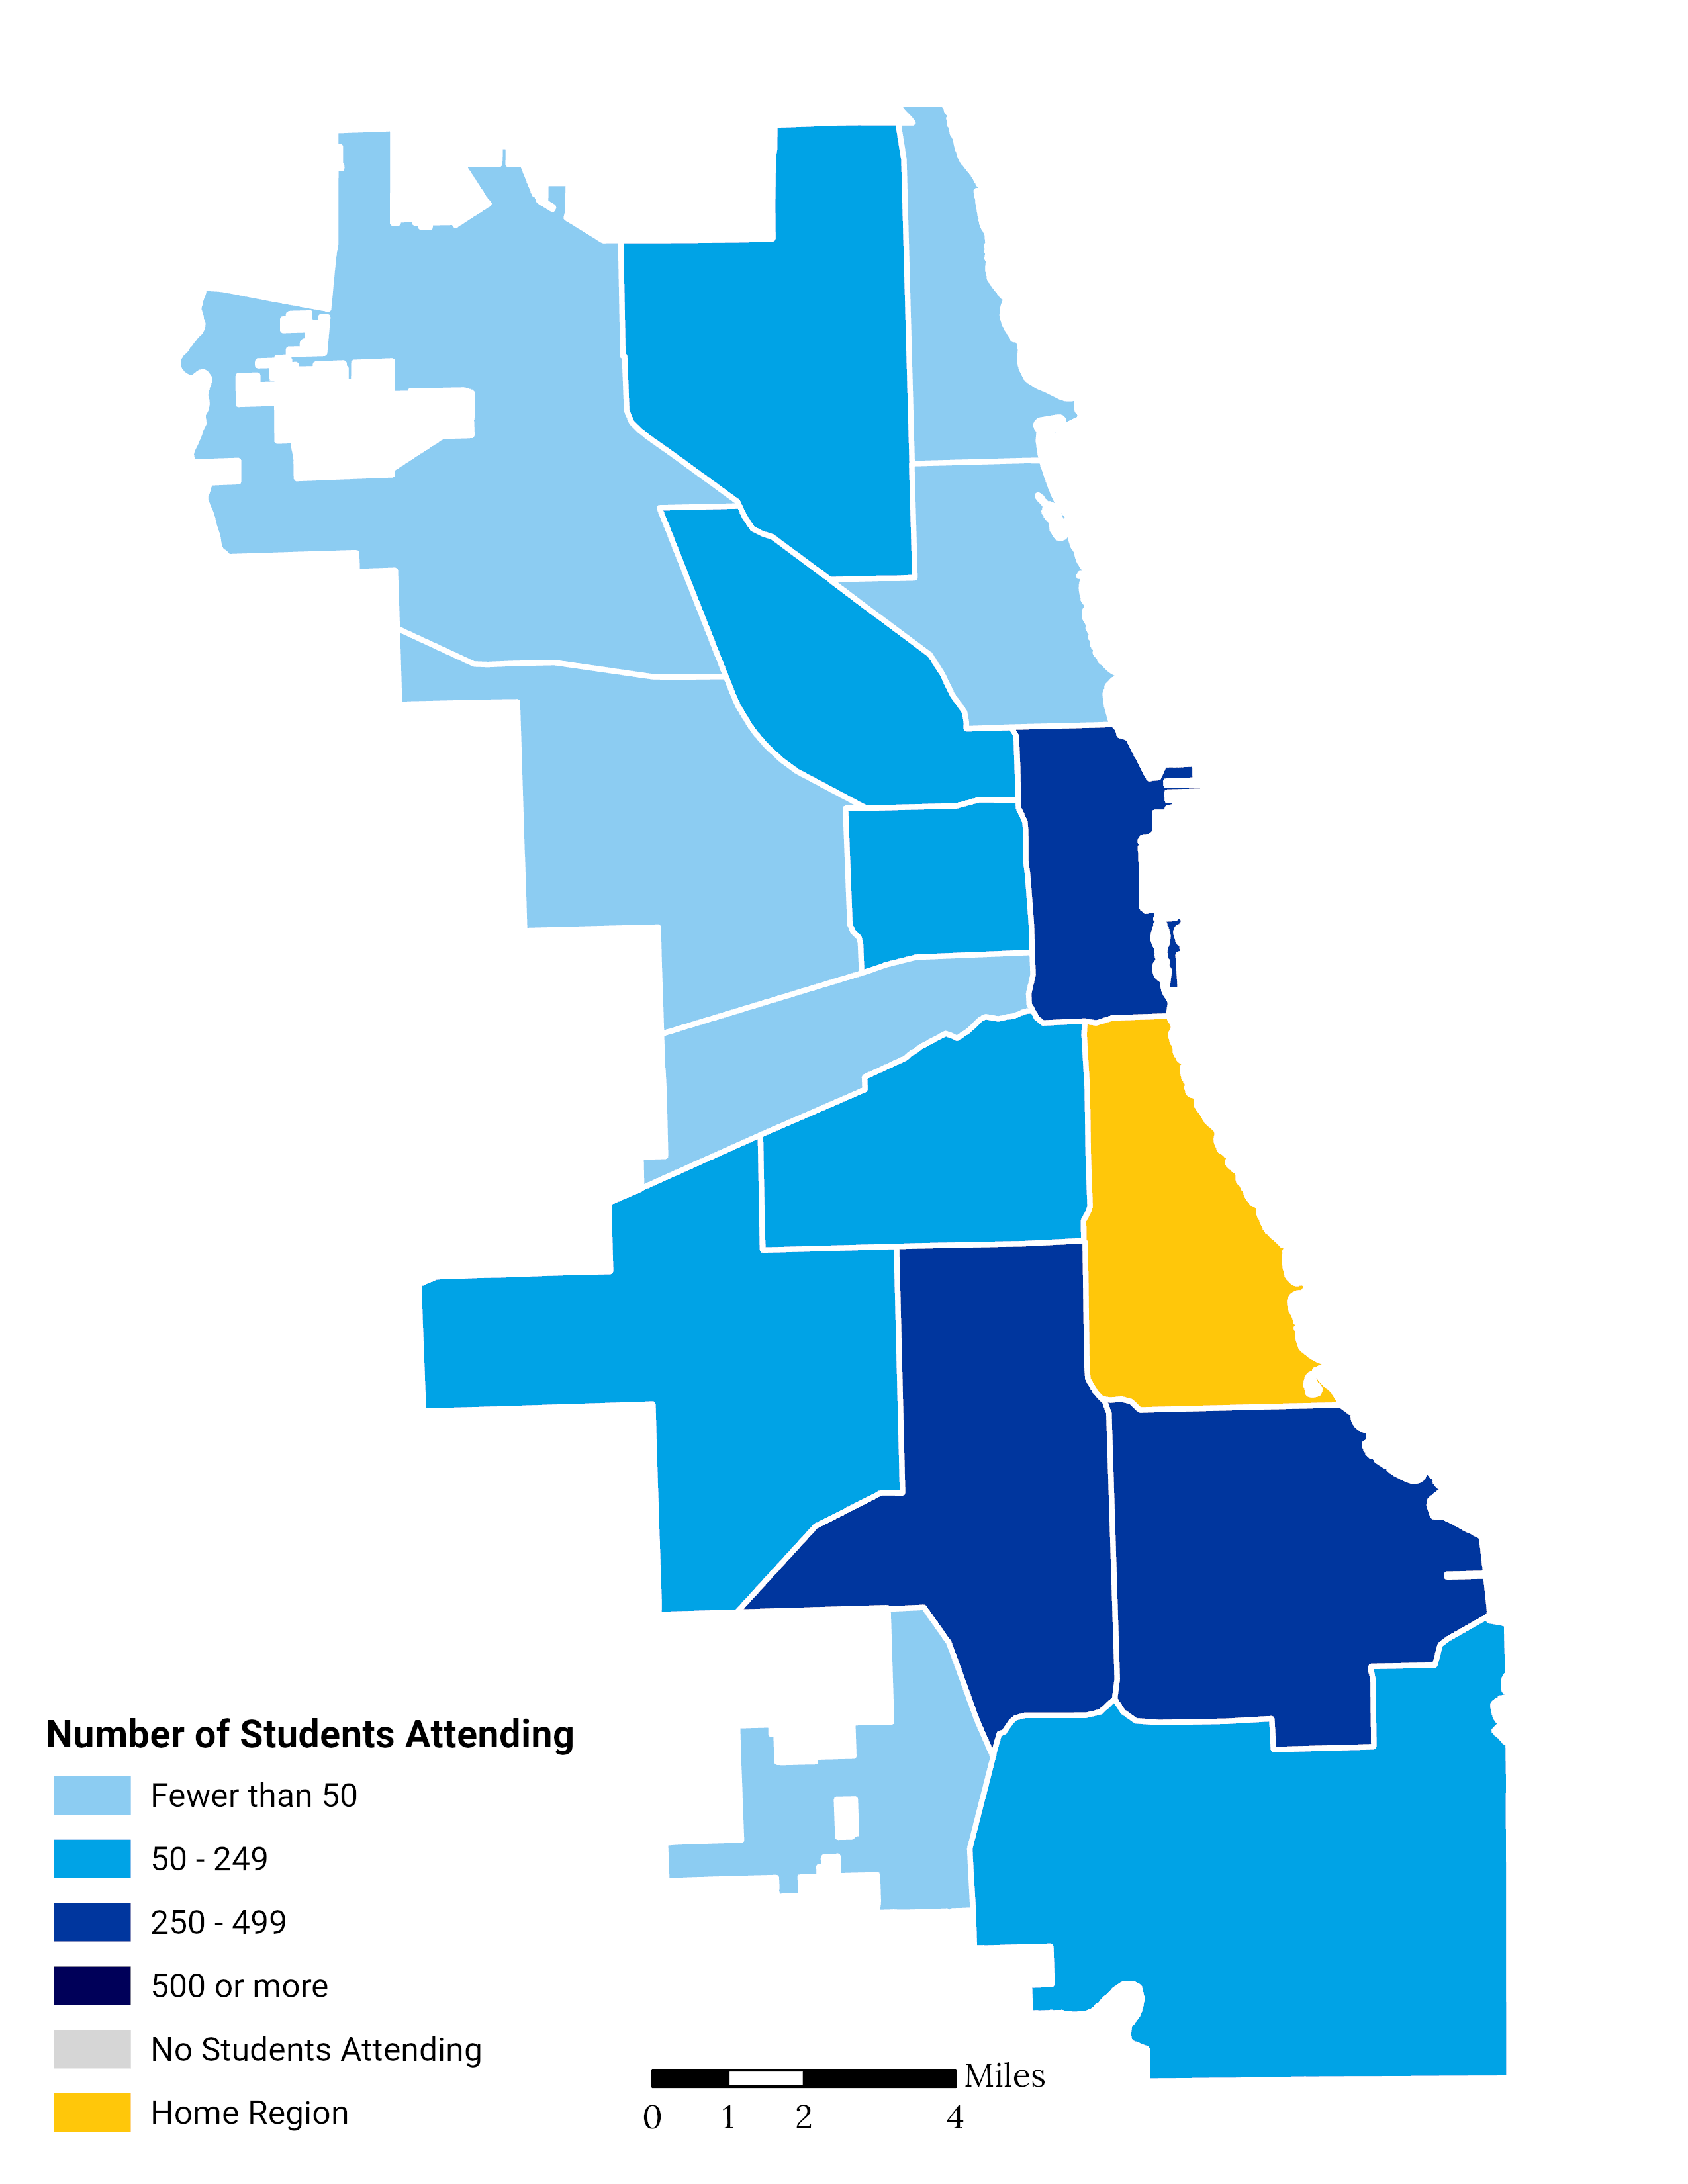
Are Options High School Students Choosing Schools in the Region?
Options High School Student Choice Over Time
Options high schools serve students who need a new pathway toward high school graduation. CPS schools offer additional supports and services for students who have been out of school and seek to return or who may need opportunities to earn credits in an accelerated program. Some of CPS’ campuses offer additional supports such as counseling and alternative schedules for students who may work during the traditional school day.
Options high schools exist in every region except the Greater Lincoln Park and Far Southwest Side regions. Options high schools do not have attendance zones or admission criteria although many serve only students 16 years and older. Students can choose to attend any Options high school within or outside of their home region. For this reason, Choice patterns tend to differ for Options students compared to elementary and other high school students.
Over the past four years, the percent of Bronzeville / South Lakefront region Options high school students attending a school in the region has decreased from 32% to 26%. In the Bronzeville / South Lakefront region, Options high school students attend school out of the region at the same rate as elementary students (26%) and at a rate less than other high school students (38%). District-wide, 58% of Options high school students attend school out of region which is greater than elementary students (18%) and other high school students (43%).
Options High School Student Attendance Type Over Time
Options High School Student Attendance Type Over Time
NOTE: Due to rounding, some charts may not add up to 100%.
Options High School Student's Distance Traveled to School
The median travel distance for Options high school students residing in the region is 4.9 miles to school, which is 1.5 miles more than the district median. Of the 360 Options high school students in the region, 22% travel less than 3 miles and 36% travel 6 miles or more.
Travel data can be helpful in understanding the overall choice patterns for the region. In general, shorter commutes can indicate that more or better school options are available within the region while longer commutes may mean that students are opting to travel greater distances to their school of choice.
Options High School Students Distance Traveled to School
Region median: 4.9 mi.
District median: 3.4 mi.
Options High School Students Distance Traveled to School
NOTE: The travel distance and time medians represent the midpoint in each group of data. The midpoint is the point where 50% of students in the region travel shorter than this distance/time and 50% travel longer than this distance/time. Using a median more fairly represents travel data and reduces the influence of extreme values such as students who attend school very far away from their home region.
Distance traveled and commute time are calculated based on the student’s home address and the address of their school. Commute distance and time was calculated using Google Maps travel estimates and includes a combination of walking and public transit data. The analysis takes into account school start times and chooses routes that minimize unnecessary travel and wait time. Any wait time before a trip starts is not included but wait times due to transfers are included.
Due to rounding, some charts may not add up to 100%.
Options High School Student's Time Traveled to School
The median travel time for Options high school students residing in the region is 35 minutes, which is 5 minutes more than the district median. Of the 360 Option high school students in the region, 34% travel less than 30 minutes and 26% travel 45 minutes or more.
Travel data can be helpful in understanding the overall choice patterns for the region. In general, shorter commutes can indicate that more or better school options are available within the region while longer commutes may mean that students are opting to travel greater distances to their school of choice.
Options High School Students Time Traveled to School
Region median: 35 min.
District median: 30 min.
Options High School Students Time Traveled to School
NOTE: The travel distance and time medians represent the midpoint in each group of data. The midpoint is the point where 50% of students in the region travel shorter than this distance/time and 50% travel longer than this distance/time. Using a median more fairly represents travel data and reduces the influence of extreme values such as students who attend school very far away from their home region.
Distance traveled and commute time are calculated based on the student’s home address and the address of their school. Commute distance and time was calculated using Google Maps travel estimates and includes a combination of walking and public transit data. The analysis takes into account school start times and chooses routes that minimize unnecessary travel and wait time. Any wait time before a trip starts is not included but wait times due to transfers are included.
Due to rounding, some charts may not add up to 100%.
Where are Options High School Students Choosing to Attend Outside the Region?
Choice Footprint Map and Table
This map illustrates the current choice footprint of 9th-12th Options high school students residing in the Bronzeville / South Lakefront region.
The Central Area, South Side, and Greater Stony Island regions are enrolling the greatest overall number of Options high school students who reside in the Bronzeville / South Lakefront region but attend school out of the region.
Map of Options High School Locations and
Where Options High School Students Reside and Attend
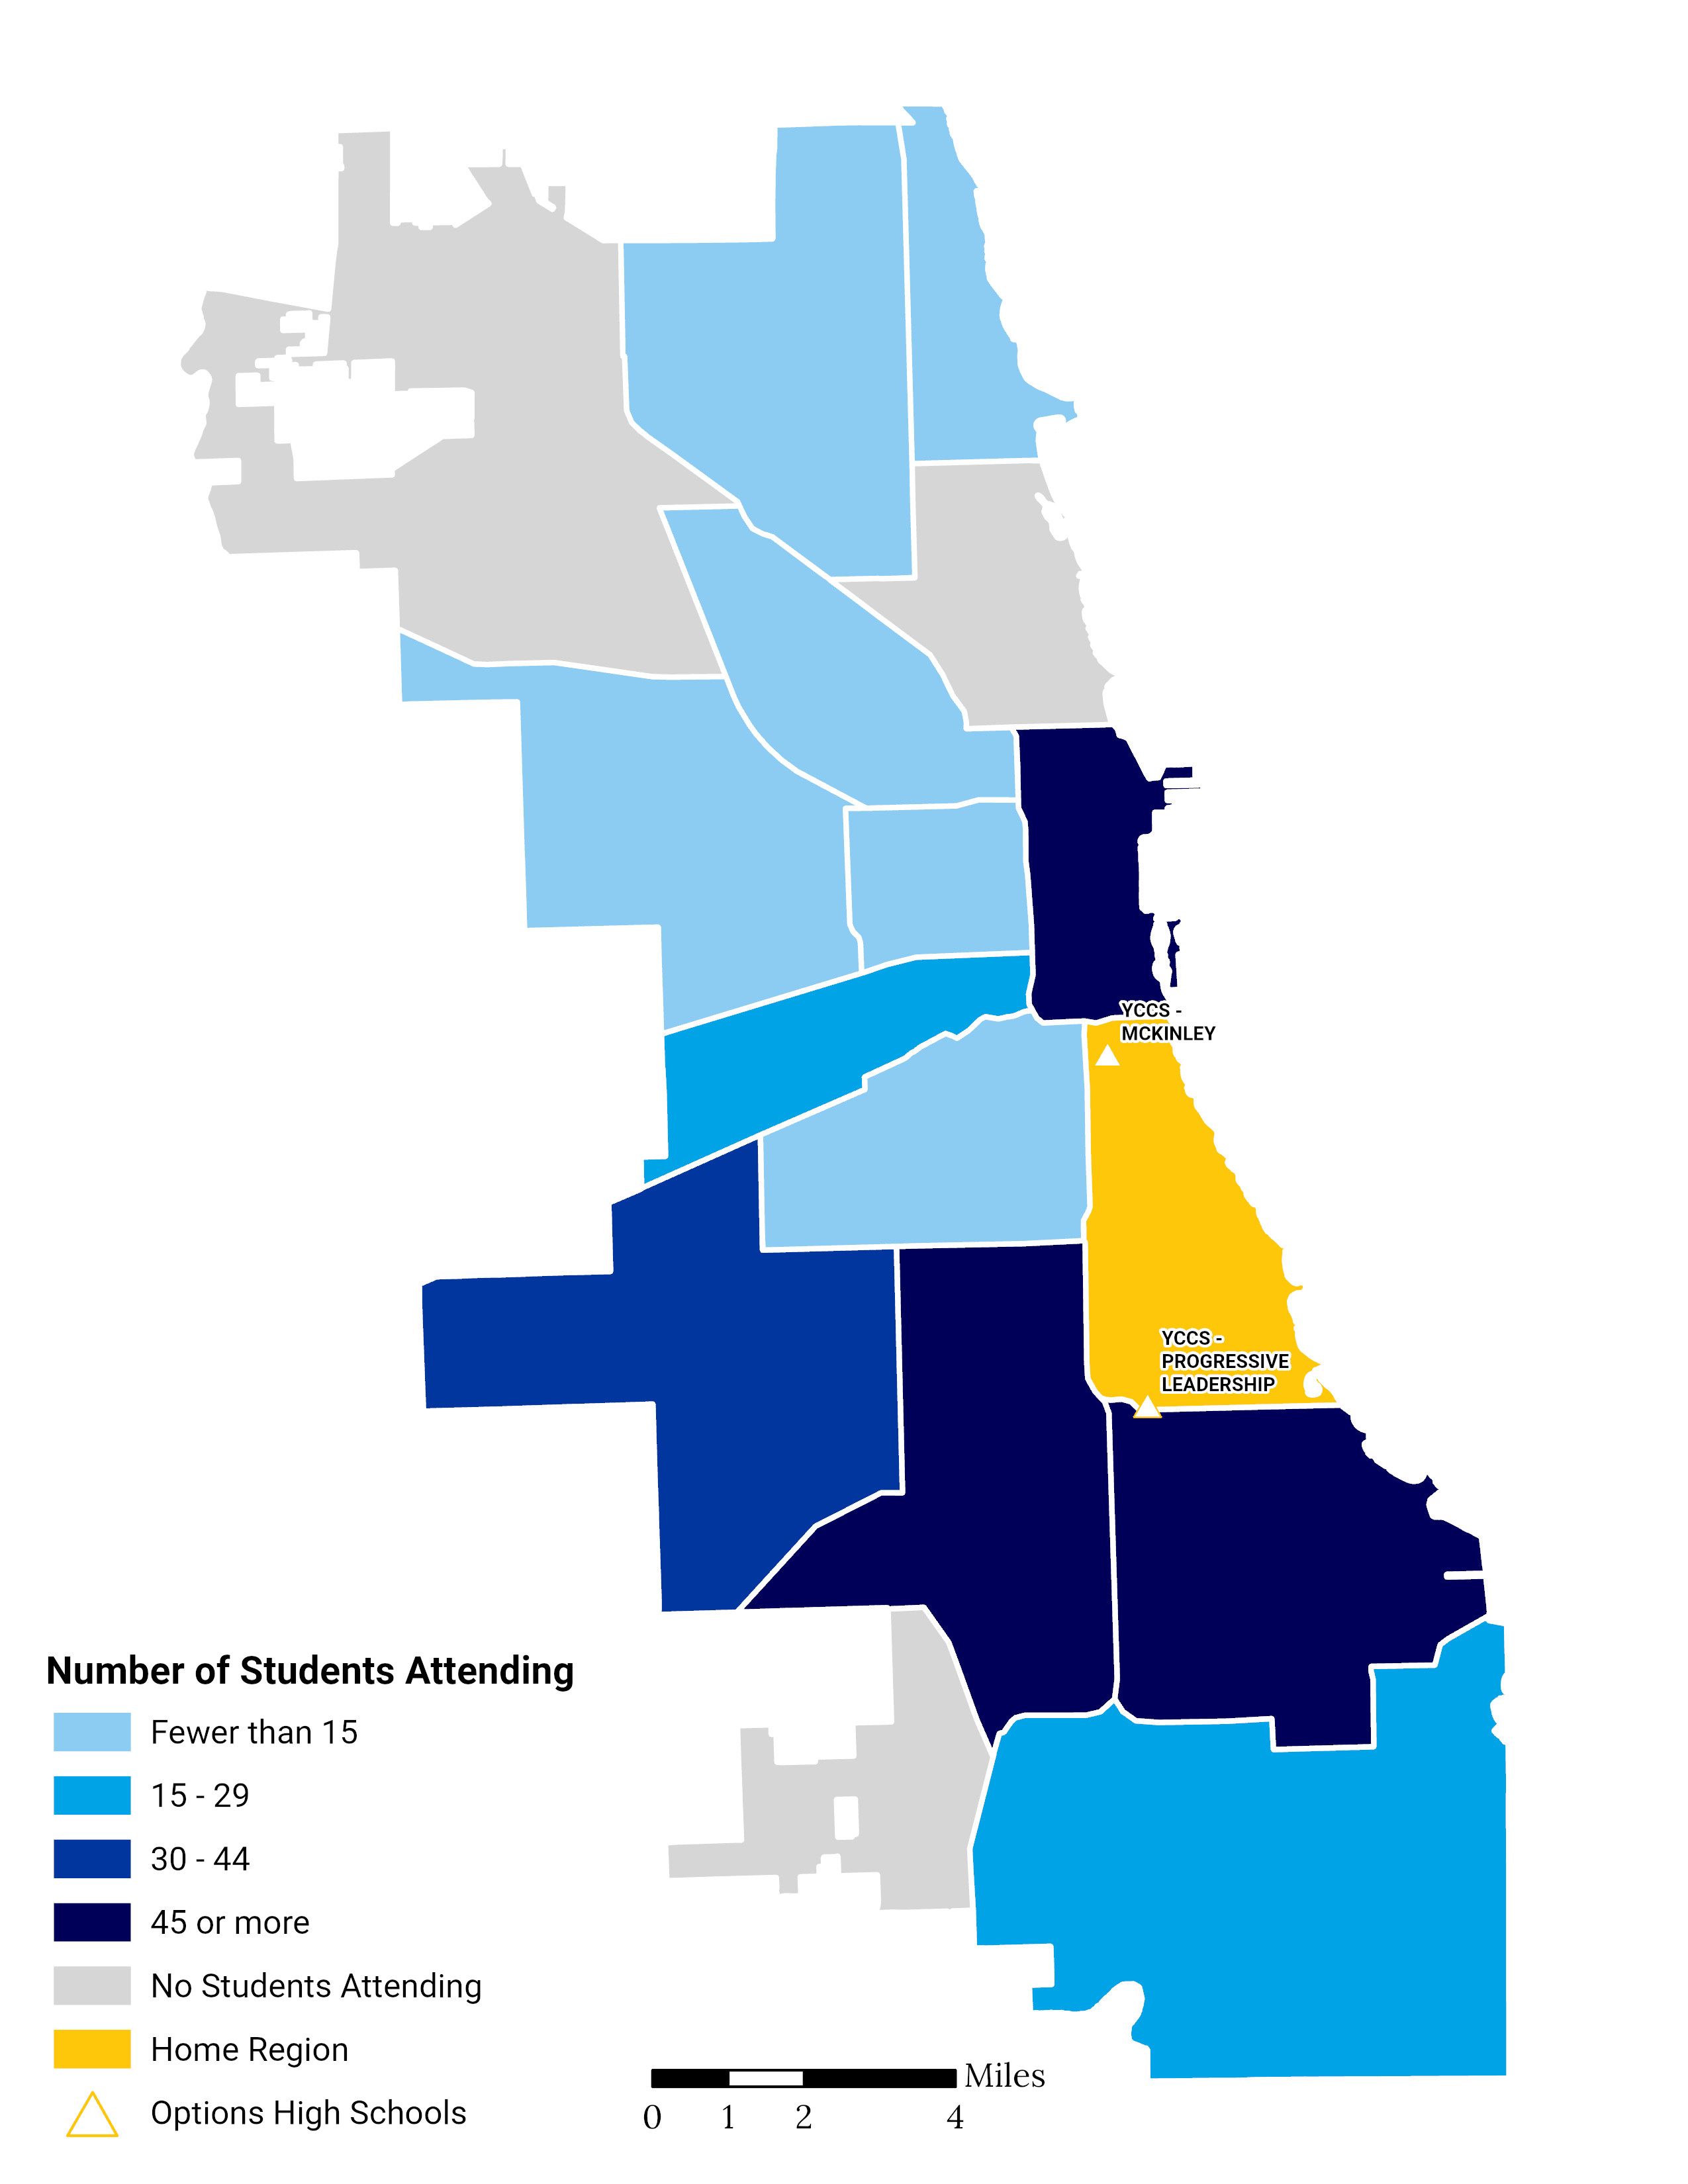
NOTE: Share of Options high school students by region is provided to show the proportion of HS students who attend an Options high school compared to all HS students who reside in that region.
Options high school students can attend school in or out of the region except for in the Far Southwest Side and Greater Lincoln Park regions which do not contain Options high schools.
Options high schools do not have attendance zones or admission criteria although many serve only students 16 years and older.
Options High School Students