A Note on Available Performance Metrics
CPS is currently transitioning to the new Continuous Improvement and Data Transparency policy. This policy replaces the district's previous School Quality Rating Policy (SQRP).
Once implemented, additional metrics will be published that offer a holistic perspective on student, school, and district performance. To learn more about the district's accountability redesign efforts or the updated policy, visit Continuous Improvement and Data Transparency.
How Has School Quality Led to Student Preparedness for Postsecondary Success?
High School Graduation
In the 2024-25 school year, 83% of high school students graduated high school in four years. Since 2021-22, the high school graduation rate has increased from 81%.
Map of 4-Year Graduation Rate by Home Region
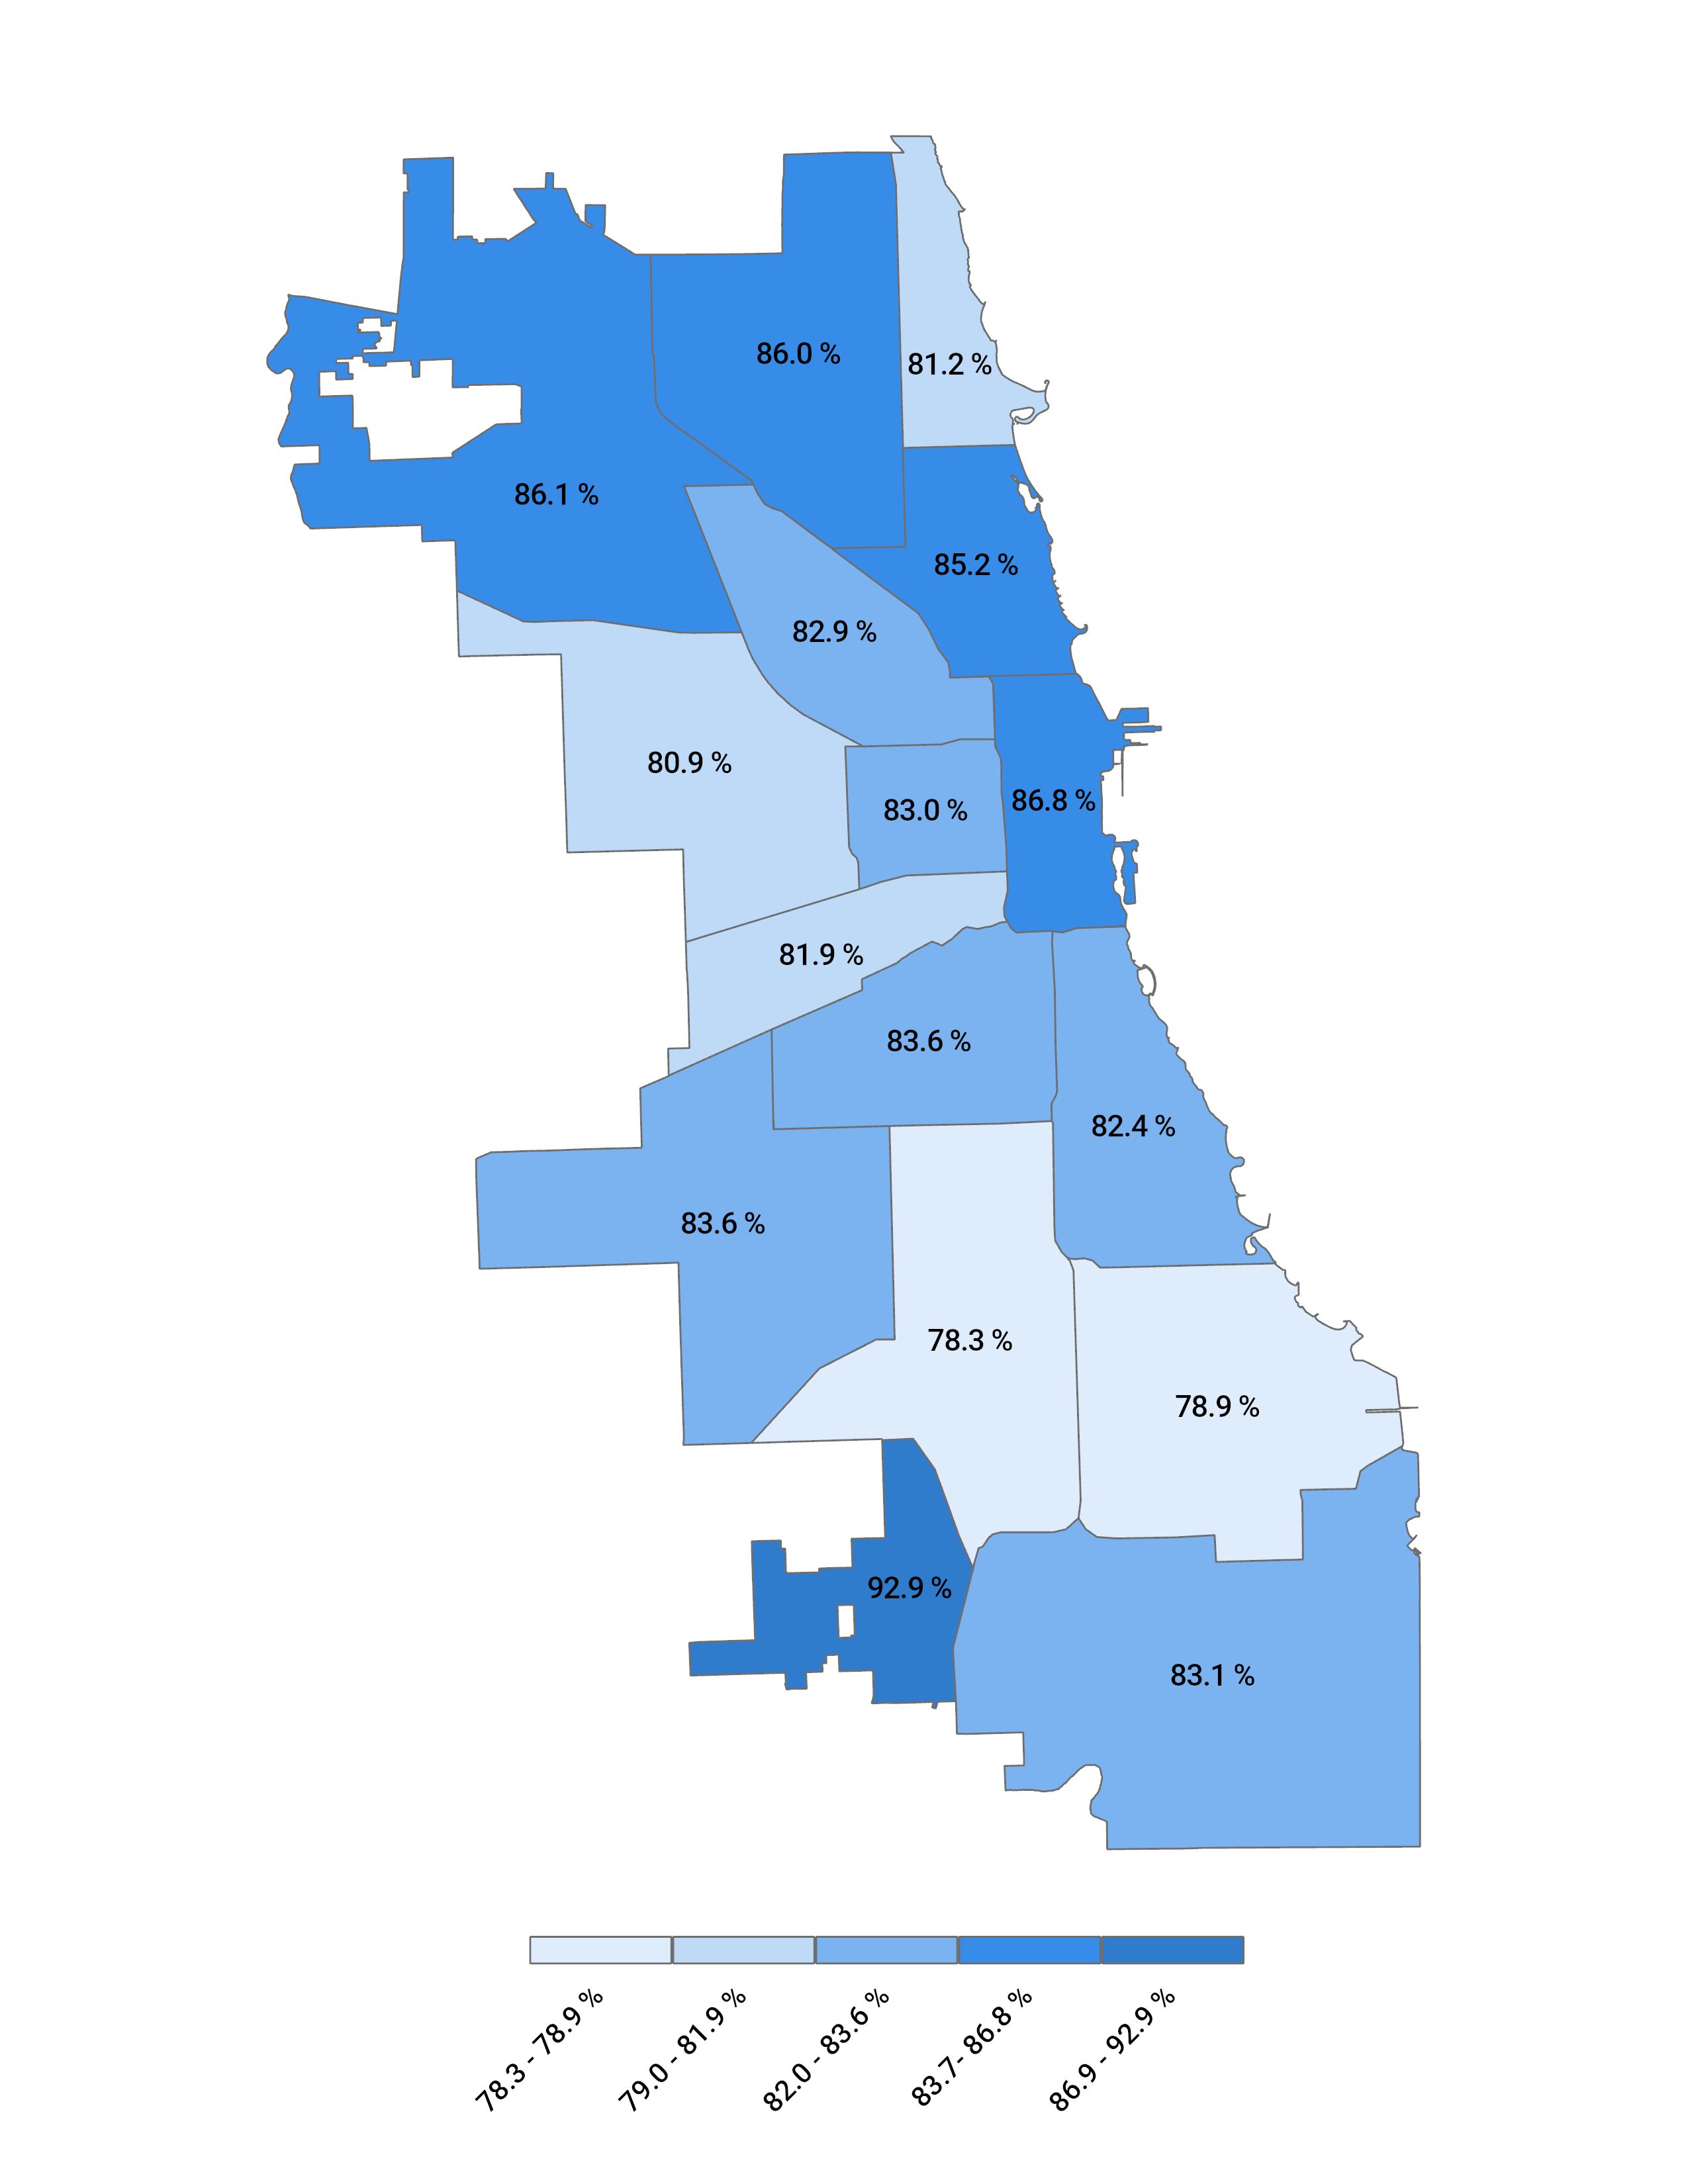
4-Year Graduation Rate by Home Region
4-Year Graduation Rate by Home Region
NOTE: For more information about how the high school graduation rate is calculated, visit District Metrics.
College Enrollment
For high school students who graduated in 2024, 69% enrolled in college after graduation. Since the class of 2021, the college enrollment rate has increased from 62%.
Map of College Enrollment Rate by Home Region
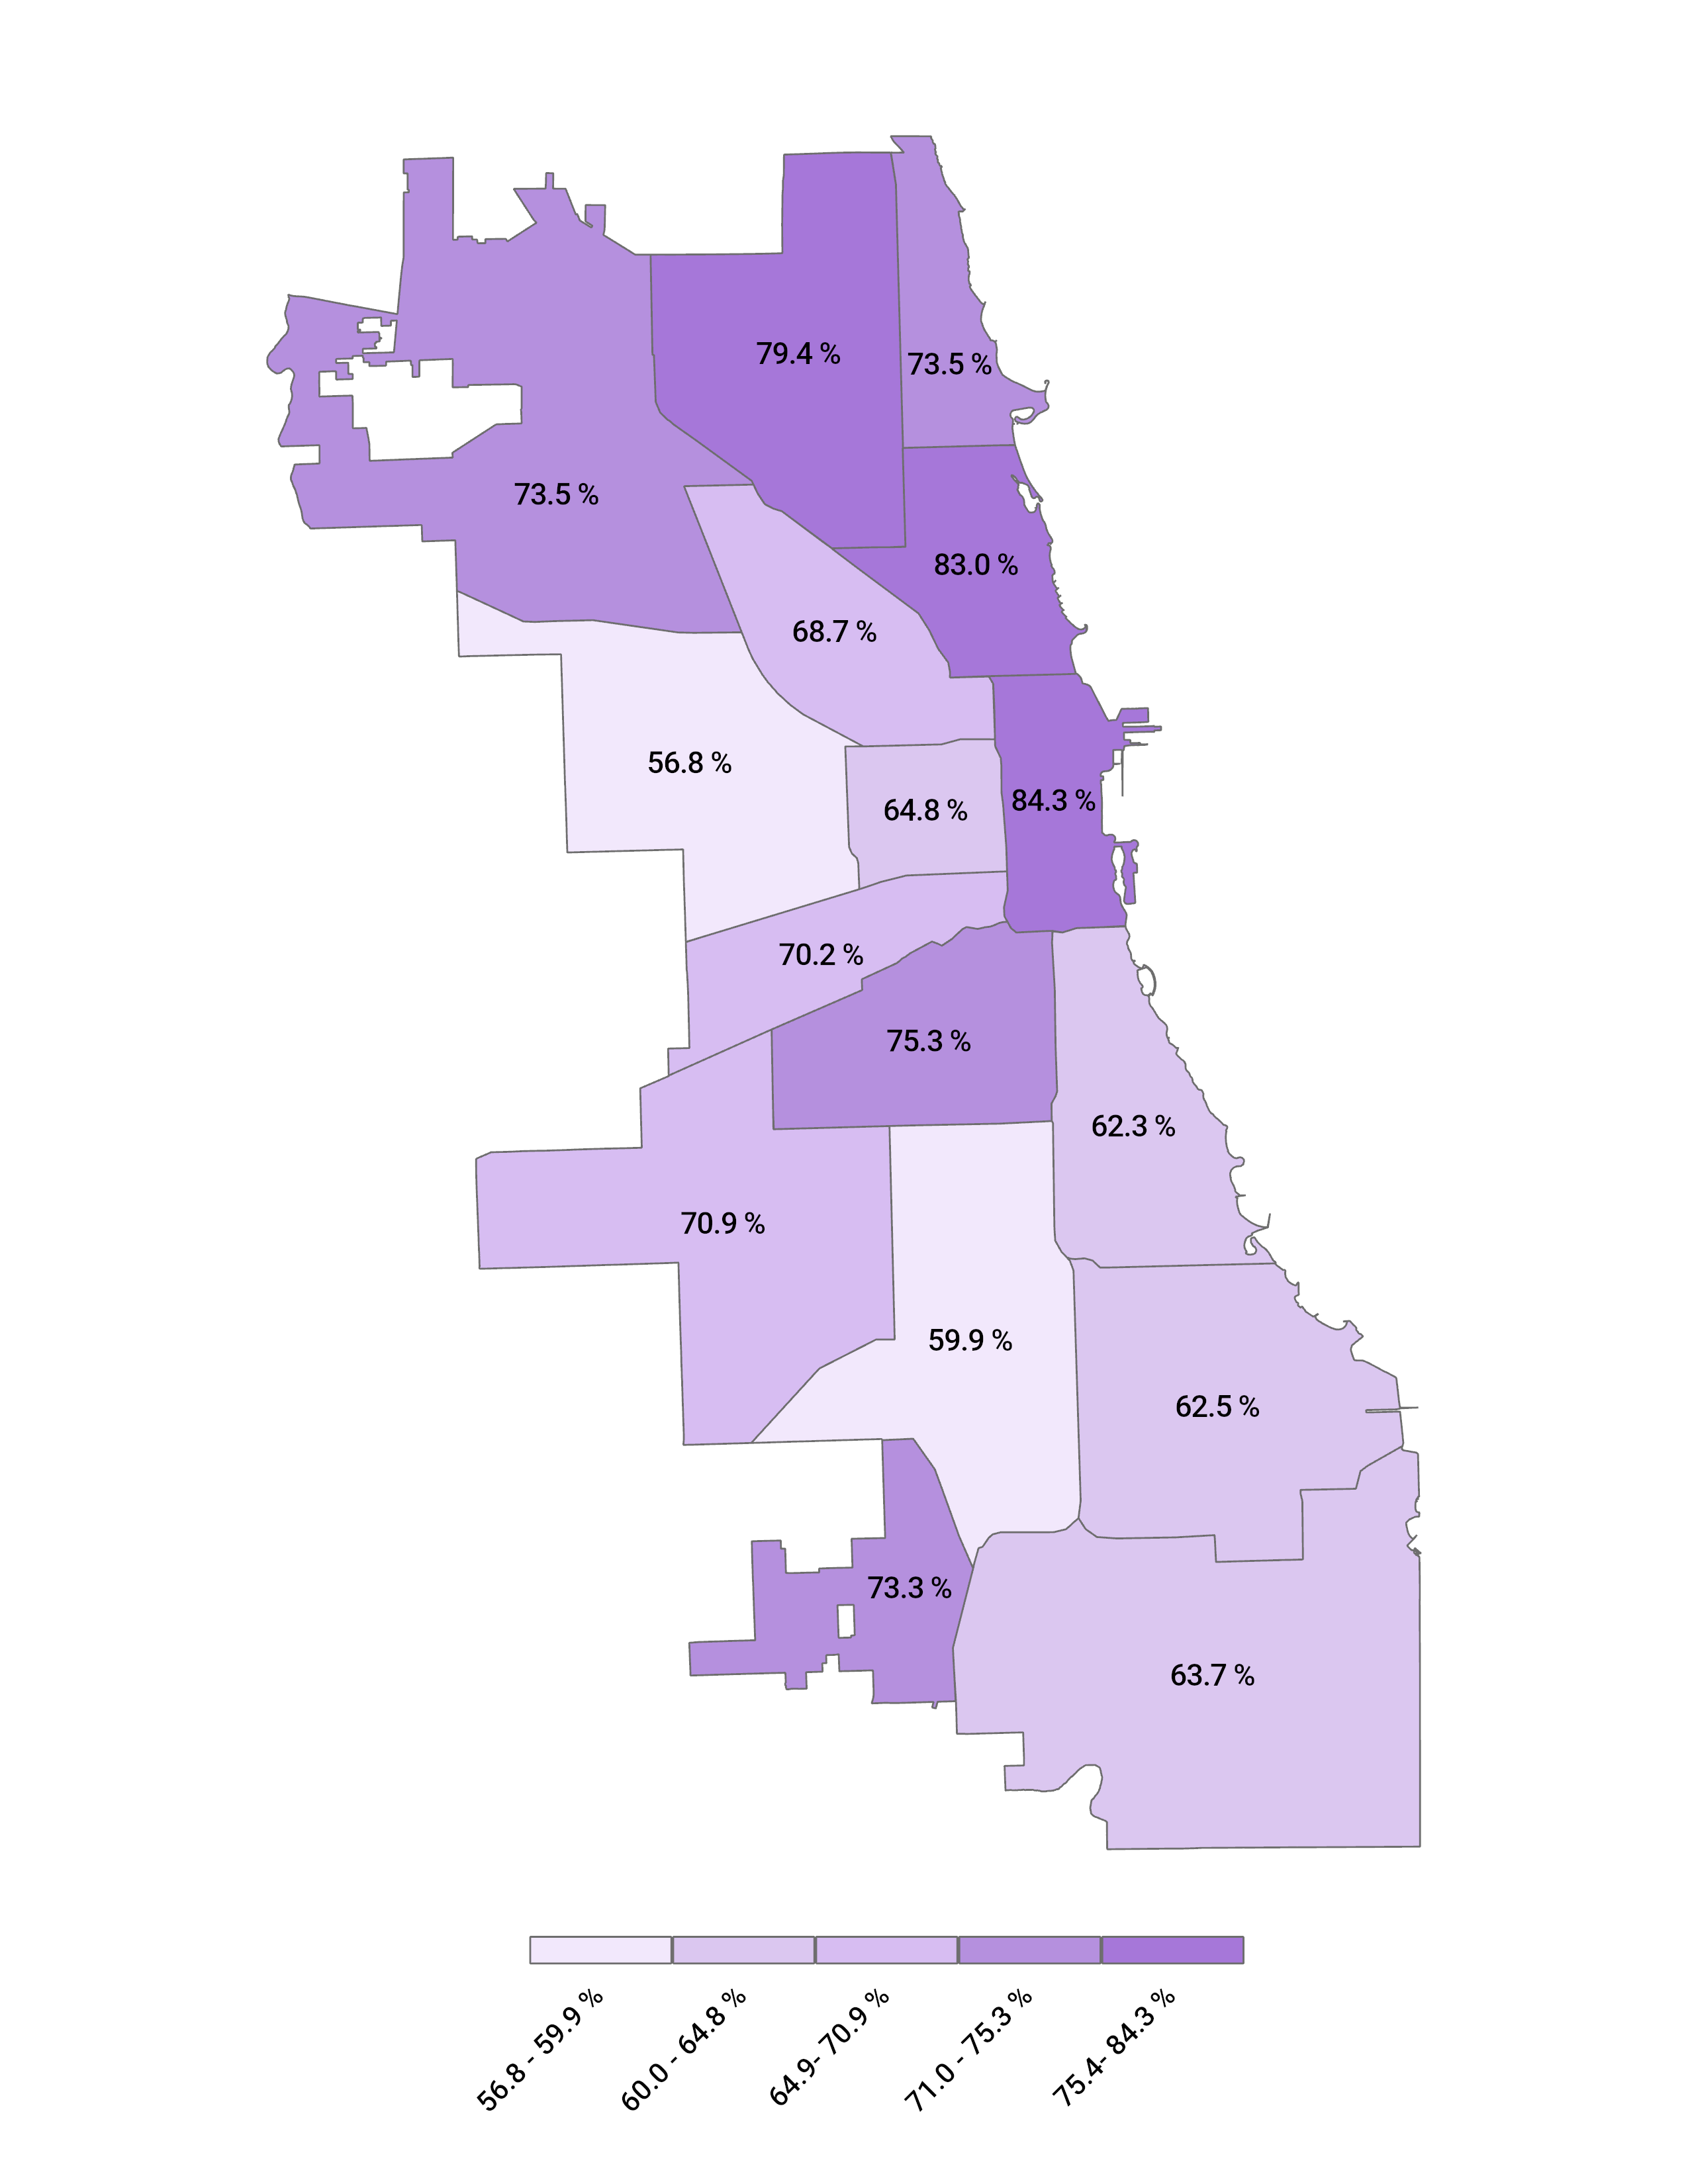
NOTE: The graduating class of 2024 is the most recent year that college enrollment data is available.
For more information about how the high school graduation rate is calculated, visit District Metrics.
College Persistence
For high school students who graduated in 2023, 75% enrolled and persisted in college. Since the class of 2020, the college persistence rate has increased from 71%.
Map of College Persistence Rate by Home Region
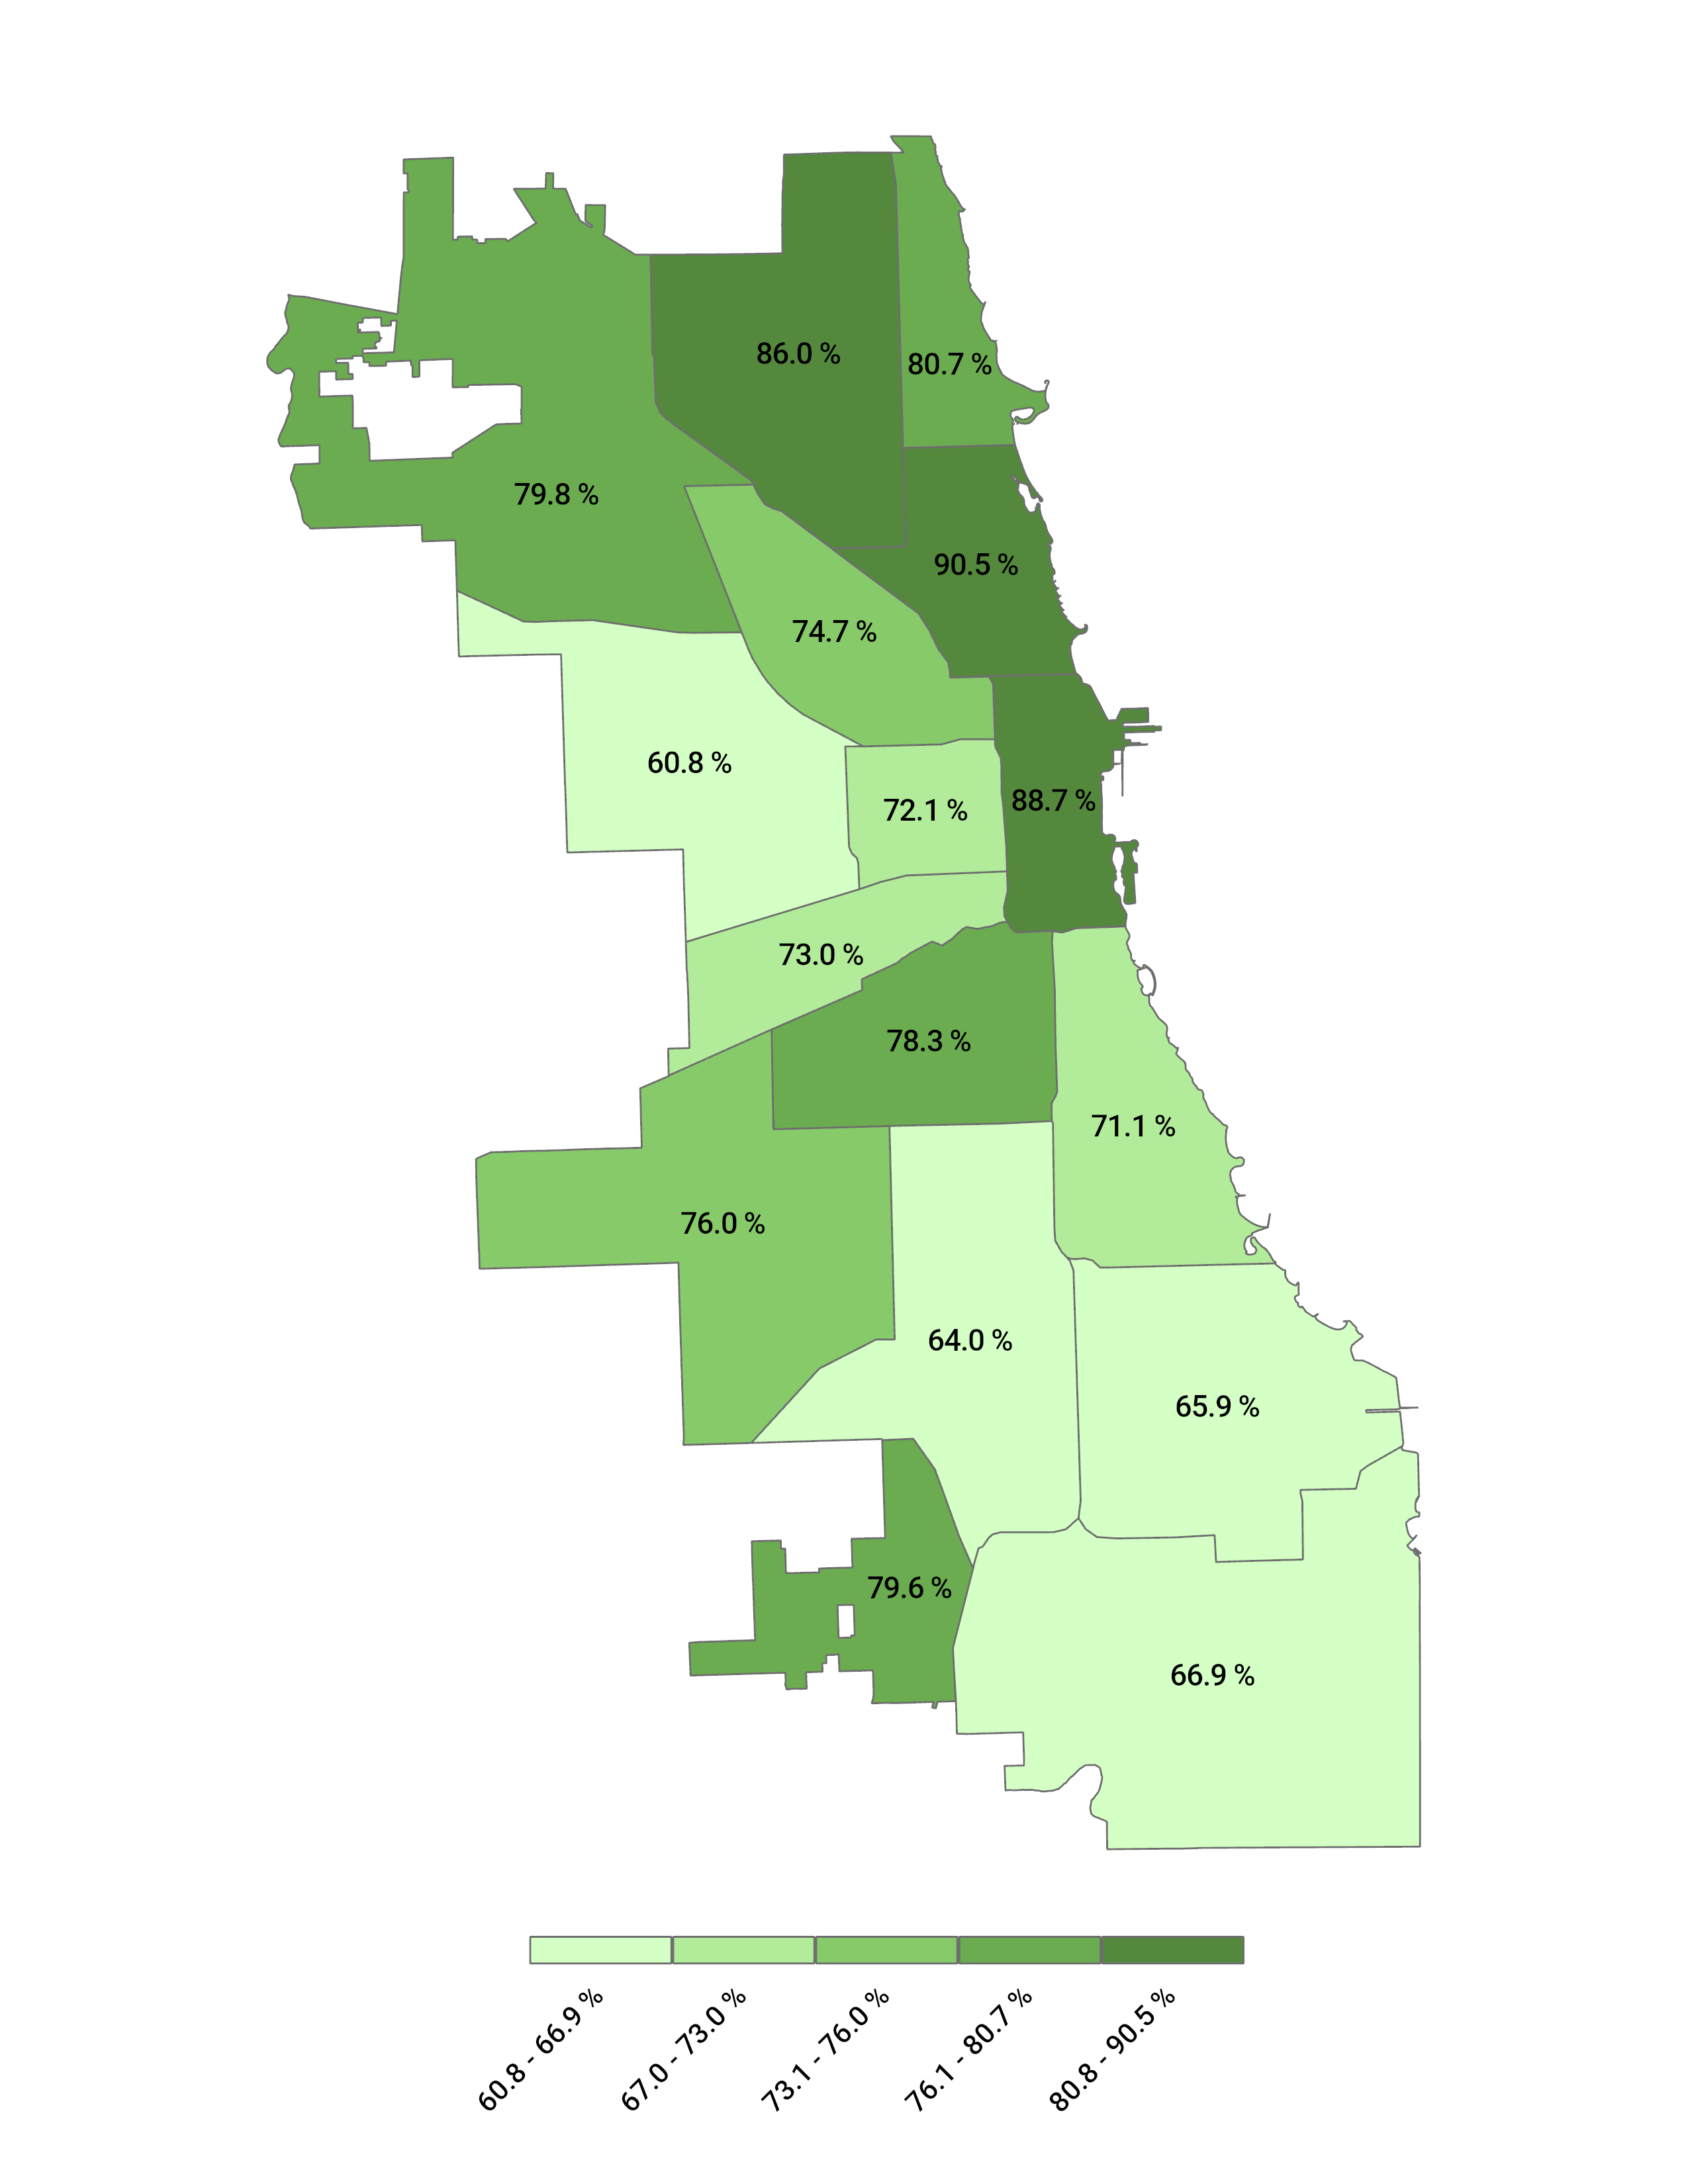
College Persistence Rate by Home Region
College Persistence Rate by Home Region
NOTE: The graduating class of 2023 is the most recent year that college persistence data is available.
For more information about how the high school graduation rate is calculated, visit District Metrics.