Do Students Have Access to the Variety of Schools and Programs Offered?
Elementary School Program Density Maps
The Program Density Index measures the density of certain academic programs in each region. The index is calculated as the number of program seats per 100 age-eligible CPS students who reside in the region. This index can be used to compare program availability across regions. For more information about types of programs, visit Academic Program Request for Proposal.
Dual Language and World Language
All regions offer either elementary World Language Magnet/Magnet Cluster or Dual Language programming. The Greater Lincoln Park, Near West Side, and Greater Milwaukee Avenue regions have the greatest density of language program seats.
Fine & Performing Arts
All regions offer some elementary Fine & Performing Arts programming. The Greater Lincoln Park, North Lakefront, and Central Area regions have the greatest density of arts program seats.
International Baccalaureate
All regions offer some elementary International Baccalaureate (IB) programming. The Central Area, Near West Side, Far Southwest Side, and North Lakefront regions have the greatest density of IB program seats.
Selective Enrollment
Selective Enrollment elementary programs (Regional Gifted Centers, Classical, and Academic Centers) are present in 14 regions. The Near West Side, Bronzeville / South Lakefront, and Far Southwest Side have the greatest density of selective enrollment seats.
STEM/STEAM
Science, Technology, Engineering, and Math (STEM) and Science, Technology, Engineering, Arts, and Math (STEAM) elementary programs are present in 13 regions. The Near West Side, West Side, and Greater Stockyards regions have the greatest density of STEM/STEAM program seats.
Elementary Program Density Table
(Number of Program Seats Per 100 Students)
1. Program capacity data is from SY25 and has not been updated for SY26. Program capacity data is self-reported by schools and fluctuates year to year. Data regarding the presence of programs or the number of seats in programs may be missing or incomplete.
2. Academic Centers (AC) offer accelerated instruction and the ability to earn high school credit to 7th and 8th grade students. All 7 CPS ACs are located at CPS high schools and may offer continuous 7-12 enrollment. To be admitted, students must apply to Academic Centers through the GoCPS application process.
3. Dual Language (DL) programs include one-way and two-way programs. One-way DL provides instruction in two languages and serves English Learners (EL), former ELs, and heritage language speakers in the same classroom. Two-way DL provides instruction in two languages but creates a balance of ELs/heritage language learners and non-ELs in the same classroom.
4. Fine and Performing Arts (F&PA) elementary programs may be offered to students outside of magnet schools or magnet cluster programs. Schools receive a Creative Schools Certification indicating the strength of their arts programming. More information can be found on each school’s profile page.
5. International Baccalaureate (IB) programs at the elementary level include the Primary Years Programme (PYP) which generally serves grades K-5 and the Middle Years Programme (MYP) which generally serves grades 6-8. Elementary schools with IB may offer PYP, MYP, or both.
6. Elementary school Science, Technology, Engineering, and Math (STEM) programs offer an interdisciplinary approach to learning that prepares students for the future through a strong foundation of STEM integrated learning. A large number of elementary schools provide STEM enriched learning environments including but not exclusive to STEM, STEAM, Technology, or Magnet schools.
7. Regional Gifted Centers (RGC) and Classical schools are separate elementary school models that offer accelerated instruction across a variety of subjects. RGC and Classical schools can offer programming in K-8 but may only offer programming in certain grades. To be admitted, students must apply to RGC and Classical schools through the GoCPS application process.
8. Elementary schools offering World Language (WL) programming expose students to either American Sign Language, Arabic, Chinese, French, German, Italian, Japanese, Korean, Latin, Polish, or Spanish language content. Schools use either a FLES model (120+ minutes per week) which is designed to achieve high levels of language and cultural proficiency or a FLEX model (<120 minutes per week) which helps to develop an enthusiasm for language learning in general.
High School Program Density Maps
The Program Density Index measures the density of certain academic programs in each region. The index is calculated as the number of program seats per 100 age-eligible CPS students who reside in the region. This index can be used to compare program availability across regions. For more information about types of programs, visit Academic Program Request for Proposal.
Career & Technical Education (CTE)
High school Career & Technical Education (CTE) programs are present in 15 regions. The Far Southwest Side, Central Area, Bronzeville / South Lakefront, and South Side regions have the greatest density of CTE program seats.
Dual Language and World Language
All regions offer either high school World Language or Dual Language programming. The Central Area, Near West Side, North Lakefront regions have the greatest density of language program seats.
Fine & Performing Arts
High school Fine & Performing Arts programs are present in 11 regions. The Greater Lincoln Park, Greater Milwaukee Avenue, North Lakefront, Greater Stony Island, and Bronzeville / South Lakefront regions have the greatest density of arts program seats.
International Baccalaureate (IB)
High school International Baccalaureate (IB) programs are present in 14 regions. The Far Southwest Side, North Lakefront, Bronzeville / South Lakefront, and Greater Lincoln Park regions have the greatest density of IB program seats.
Military & JROTC
High school Military programs have specific admission criteria and are in 6 regions. Junior Reserve Officer Training Corps (JROTC) programs are in nearly all regions. The Near West Side, Far Southwest Side, and Greater Milwaukee Avenue regions have the greatest density of Military/JROTC program seats.
Selective Enrollment
High school Selective Enrollment programs are present in 9 regions. The Central Area, Near West Side, and Northwest Side have the greatest density of Selective Enrollment program seats.
STEM / STEAM
High school Science, Technology, Engineering, and Math (STEM) and Science, Technology, Engineering, Arts, and Math (STEAM) programs are present in 10 regions. The North Lakefront, Near West Side, Greater Midway, South Side, and West Side regions have the greatest density of STEM/STEAM program seats.
High School Program Density Table
(Number of Program Seats Per 100 Students)
1. Program capacity data is from SY25 and has not been updated for SY26. Program capacity data is self-reported by schools and fluctuates year to year. Data regarding the presence of programs or the number of seats in programs may be missing or incomplete.
2. Career and Technical Education (CTE) programs provide experiential learning opportunities that allow students to explore careers and gain skills while still in high school. There are over 10 different CTE pathways that include exposure to Agricultural Sciences, Business, Culinary, Health Sciences, Information Technology, and Manufacturing and Pre-Engineering career areas. Schools may choose to offer one or more different CTE pathways based on student interest.
3. Dual Language (DL) programs include one-way and two-way programs. One-way DL provides instruction in two languages and serves English Learners (EL), former ELs, and heritage language speakers in the same classroom. Two-way DL provides instruction in two languages but creates a balance of ELs/heritage language learners and non-ELs in the same classroom.
4. Fine & Performing Arts schools (F&PA) are committed to providing an arts-rich learning experience that includes arts instruction, arts creation and performance, and arts related community partnerships. Schools receive a Creative Schools Certification indicating the strength of their arts programming. More information can be found on each school’s profile page.
5. International Baccalaureate (IB) programs at the high school level include the Diploma Programme (DP) which offers a rigorous, college preparatory focused curriculum and Career-related Programme (CP) which builds on the DP curriculum while integrating career-related education. High schools with IB may offer DP, CP, or both.
6. Military and Junior Reserve Officers' Training Corps (JROTC) programs aim to develop responsible cadet-leaders through high-quality instruction and enrichment opportunities that enable the development of the life skills, aspiration, and expectation needed to be college and career ready. CPS offers six dedicated Military Academies and thirty-seven JROTC programs at participating high schools.
7. High school Science, Technology, Engineering, and Math (STEM) programs offer an interdisciplinary approach to learning that engages students in hands-on, problem-based learning that prepares them for college and career. The district has a combination of Early College STEM/STEAM high schools and STEM integrated high schools across the district.
8. Selective Enrollment high schools provide academically advanced high school students with a challenging and enriched college preparatory experience. To be admitted, students must apply to Selective Enrollment schools through the GoCPS application process.
9. World Language (WL) programs provide students with intensive instruction in a world language to acquire proficiency in a non-native language as well as develop cultural understanding and awareness.
Early College and Career Credential Access
Early College and Career Credential (ECCC) programs provide access and support for rigorous, college-level, hands-on, and career-focused courses and experiences. ECCC programs advance student postsecondary success through earned college credits or professional credentials and the exposure to soft skills needed to succeed in college, civic life, and the 21st-century labor market.
There are 7 different ECCC programs available to CPS students, including:
- Advanced Placement (AP)
- Career & Technical Education (CTE)
- Dual Credit (DC)
- Dual Enrollment (DE)
- International Baccalaureate (IB)
- Junior Reserve Officer Training Corps (JROTC)
- Seal of Biliteracy (SSB)
CPS has set an ambitious goal that 60% of students will earn an Early College and Career Credential by the time they graduate and considers ECCC rates to be a measure of student preparedness for postsecondary success.
In 2024-25, 56% of students across CPS earned an ECCC. Of the 7 ECCC programs, students earned the most credentials in Advanced Placement (29% of students) and Dual Credit (22%) programs last school year.
ECCC Achievement by Program in the District
ECCC Achievement by Program in the District
NOTE: Students can earn an ECCC in more than one program. Students earning more than one credential are counted in each program category.
To learn more about AP, visit AP Credit. To learn more about CTE, DC, and DE programs, visit Early College and Career Education. To learn more about IB, visit IB Credit. To learn more about JROTC, visit www.chicagojrotc.com. To learn more about SSB, visit Seal of Biliteracy.
Early College and Career Credential Achievement
ECCC Achievement Rate by Home Region
The greatest percentage of students earning an Early College and Career Credential live in the Greater Lincoln Park region (74%) and the lowest percentage live in the West Side region (43%). The greatest overall number of students earning an ECCC live in the Far Northwest Side region (2,159) and the least live in the Near West Side region (138).
ECCC Achievement Rate by Home Region
ECCC Achievement Rate by Home Region
Map of ECCC Achievement Rate by Home Region
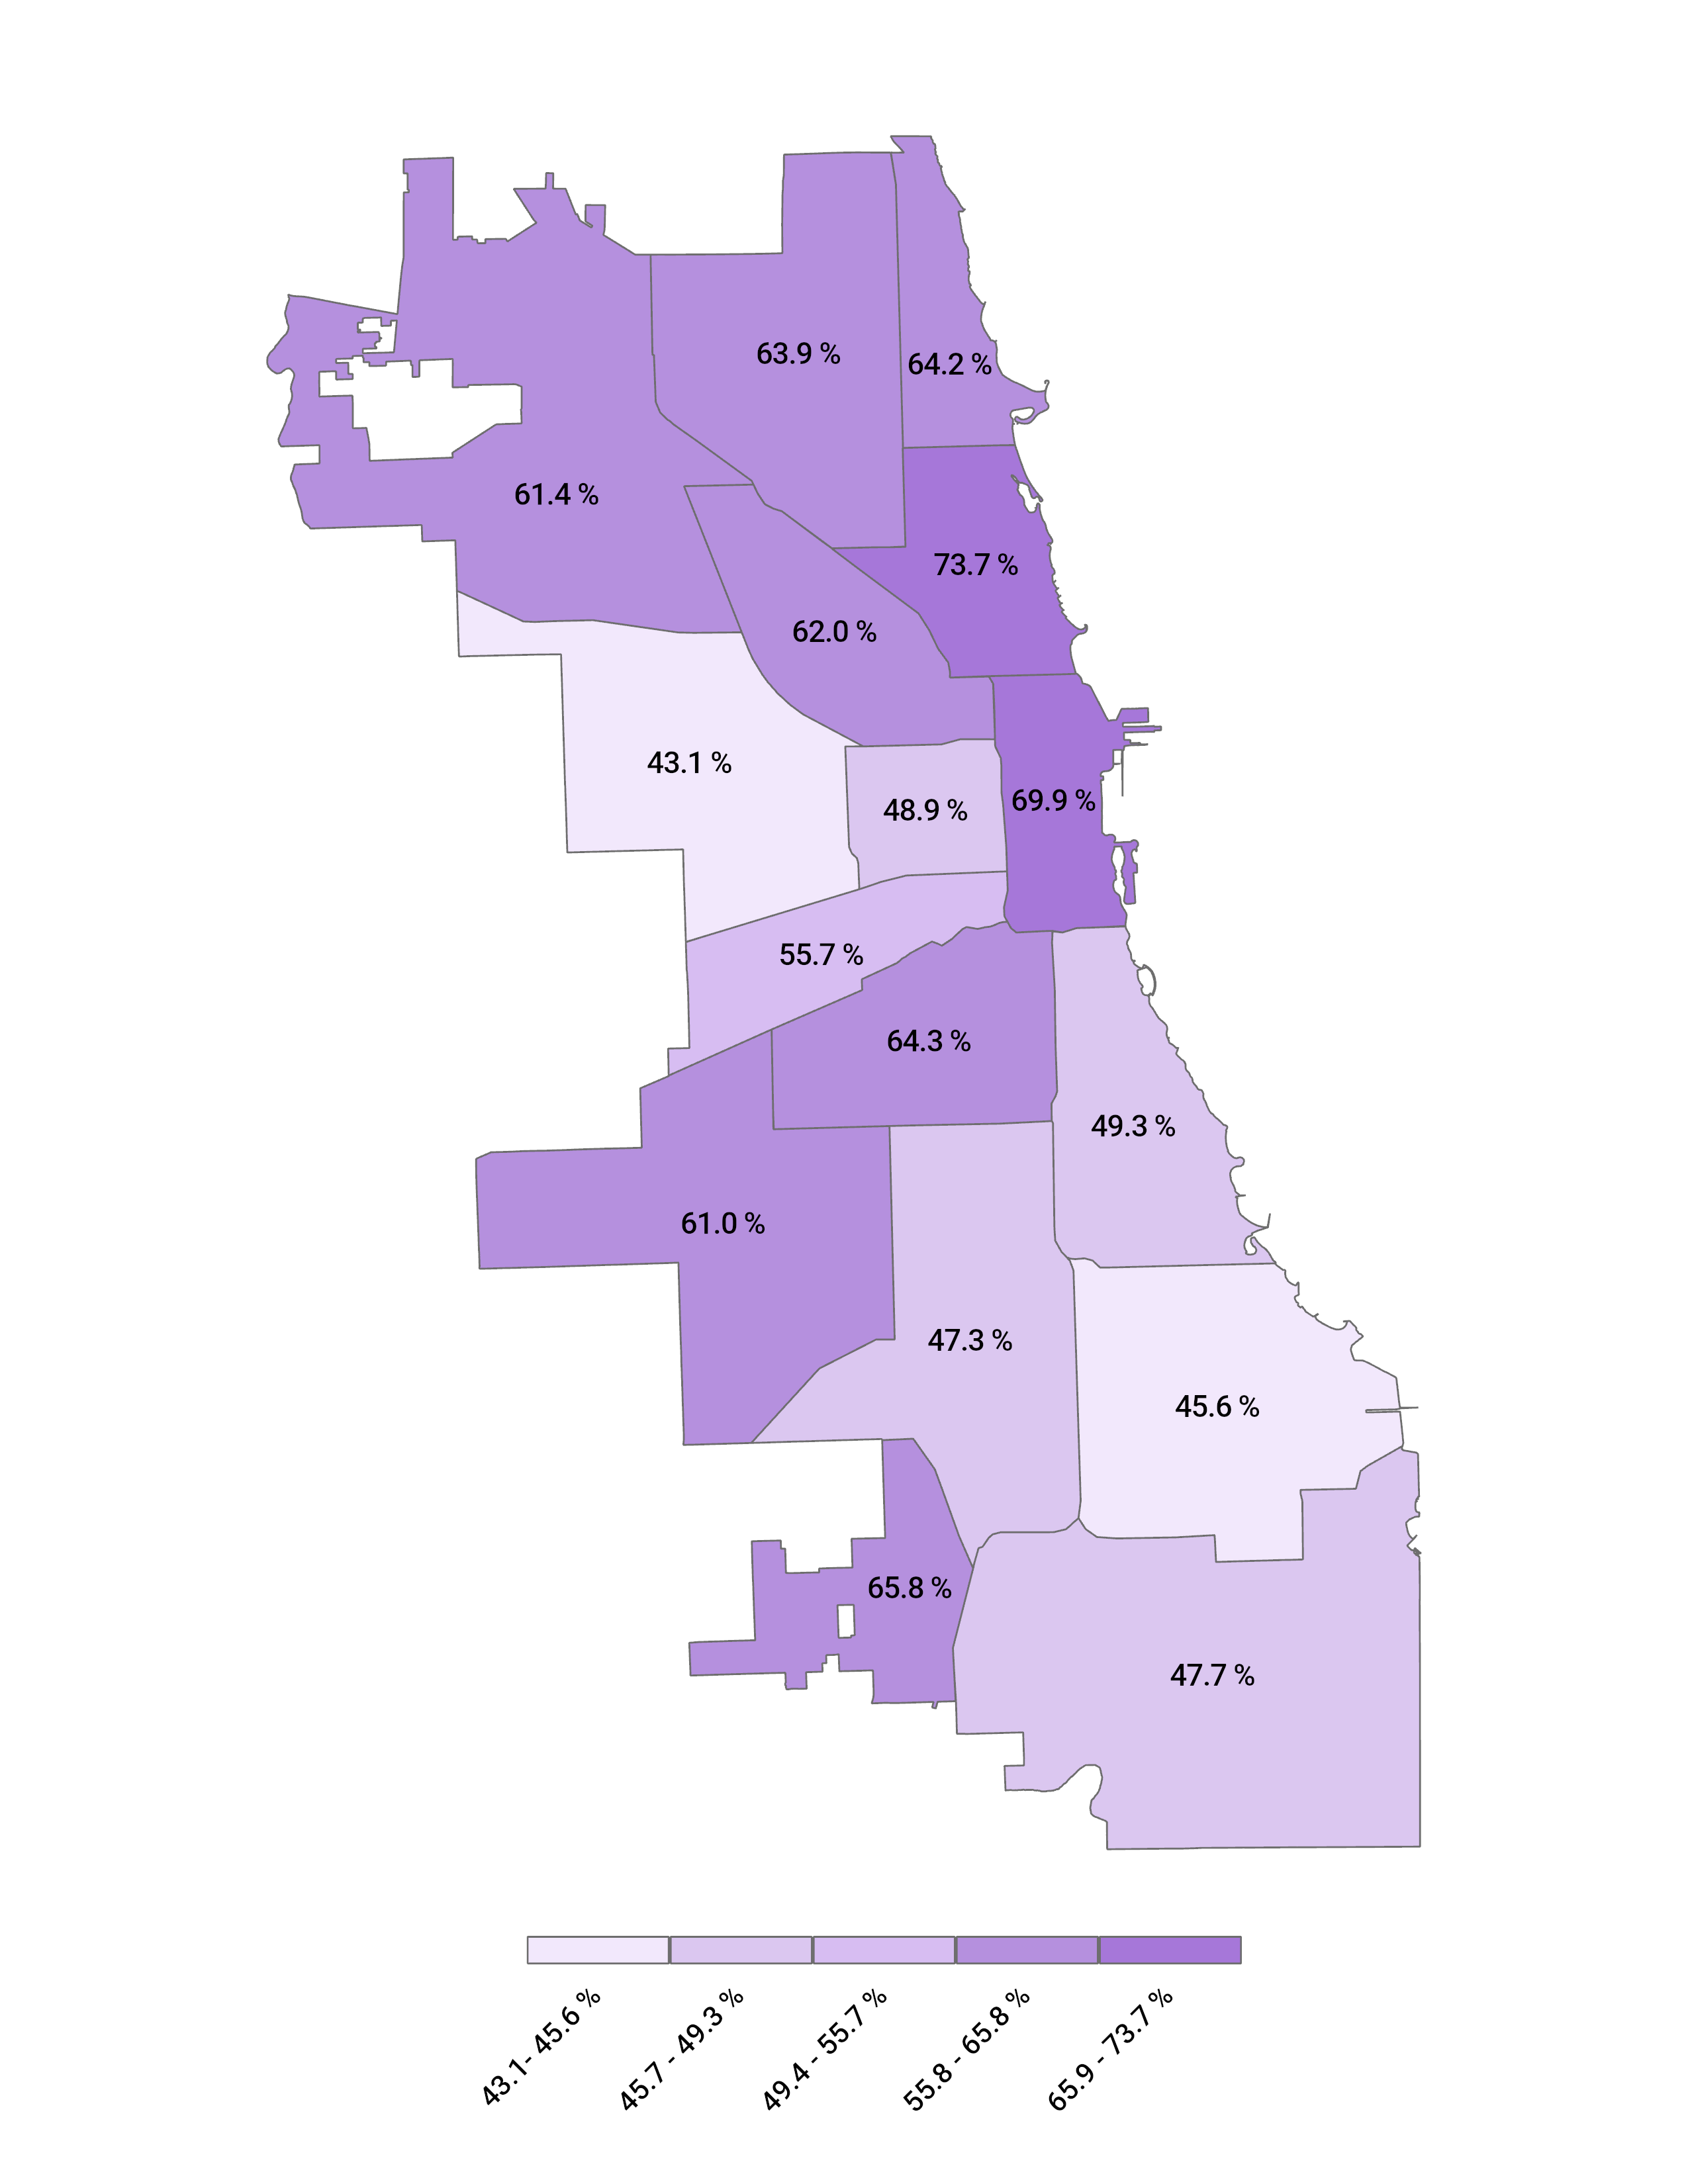
NOTE: Students can earn an ECCC in more than one program. The number of students shown in each region counts each student that earned an ECCC only once regardless of if they earned more than one credential.
ECCC Achievement Rate by Attending Region
The greatest percentage of students earning an Early College and Career Credential attend school in the Northwest Side region (71%) and the lowest percentage attend school in the Greater Stony Island region (31%). The greatest overall number of students earning an ECCC attend school in the Northwest Side region (2,313) and the least attend school in the Greater Stony Island region (245).
ECCC Achievement Rate by Attending Region
ECCC Achievement Rate by Attending Region
Map of ECCC Achievement Rate by Attending Region
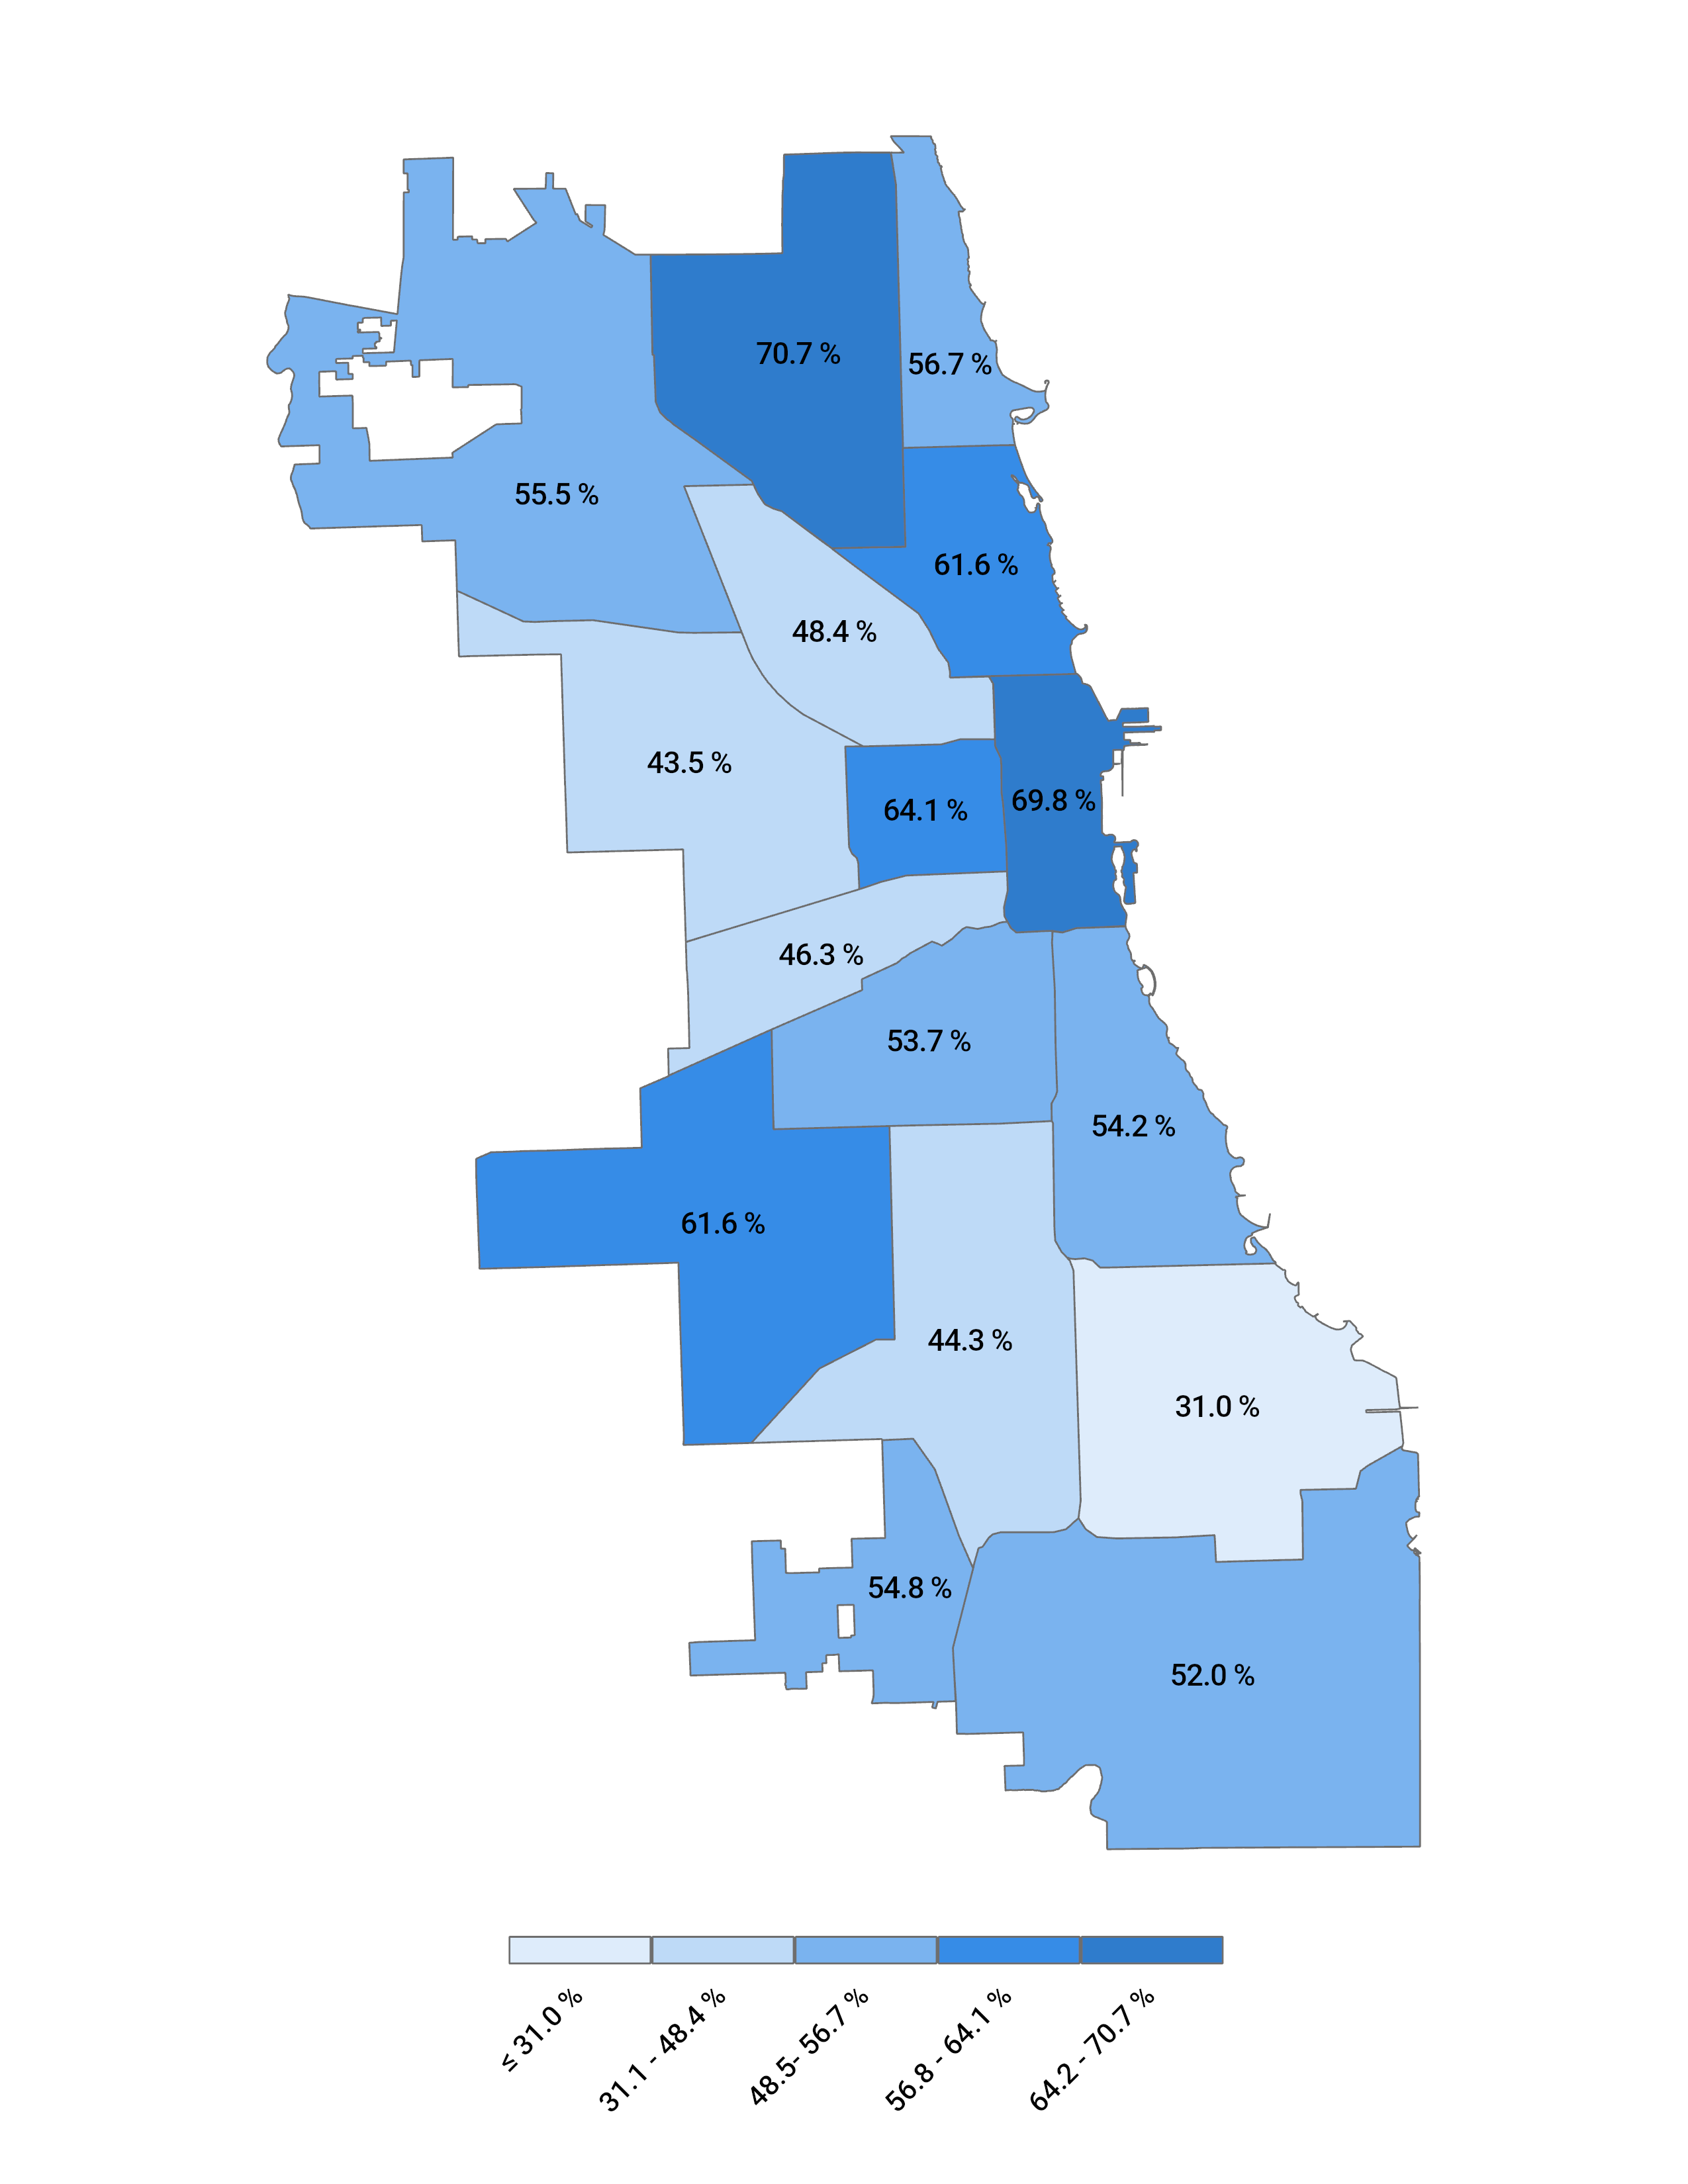
NOTE: Students can earn an ECCC in more than one program. The number of students shown in each region counts each student that earned an ECCC only once regardless of if they earned more than one credential.
ECCC Achievement Rate per Program by Home Region
| District-wide, 13,204 students earned at least one ECCC.
The greatest percentage of students earning an Early College and Career Credential in Advanced Placement (AP) live in the Greater Lincoln Park (62%) and Central Area (55%) regions.
The greatest percentage of students earning an Early College and Career Credential in Dual Credit (DC) live in the Far Southwest Side (38%) and Bronzeville / South Lakefront (33%) regions.
ECCC Achievement Rate by Program and Home Region
ECCC Achievement Rate by Program and Home Region
NOTE: Each ECCC program sets its own credential achievement criteria. To learn more, go to District Metrics.
Percentages shown are the portion of students that earned an ECCC in each program. Bars will not add up to 100% since students can earn an ECCC in more than one program. Students who earned more than one ECCC are counted in each program percentage.
ECCC Achievement Rate per Program by Attending Region
The greatest percentage of students earning an Early College and Career Credential in Advanced Placement (AP) attend school in the Central Area (62%) and Northwest Side (53%) regions.
The greatest percentage of students earning an Early College and Career Credential in Dual Credit (DC) attend school in the Bronzeville / South Lakefront (41%) and Greater Midway (32%) regions.
ECCC Achievement Rate by Program and Attending Region
ECCC Achievement Rate by Program and Attending Region
NOTE: Each ECCC program sets its own credential achievement criteria. To learn more, go to District Metrics.
Percentages shown are the portion of students that earned an ECCC in each program. Bars will not add up to 100% since students can earn an ECCC in more than one program. Students who earned more than one ECCC are counted in each program percentage.