District Choice Overview
Number of Schools in the District
Elementary Schools

High Schools

Options School

NOTE: CPS has some combined elementary and high schools that serve students across elementary and high school grades. Included in the elementary schools count are CPS middle schools which serve a subset of grades K-8. Options high schools serve students who need a new pathway toward high school graduation and many exclusively enroll students aged 16 and older.
School Attendance Boundaries in the District
CPS schools either have an attendance area or are citywide schools. Schools with an attendance area are sometimes called zoned or neighborhood schools. The boundaries of an attendance area are used to determine which home addresses within a given area are assigned to which CPS schools. Citywide schools do not have attendance areas and admit students from anywhere in the city through a lottery or application process.
Students can choose to attend either their zoned school, a citywide school, or another school of their choosing through the GoCPS application process. For information on which attendance areas a home address resides in, use the CPS School Locator at schoolinfo.cps.edu/schoollocator/index.html.
School-level admissions criteria referenced in this report are for students who applied in the application cycle that began in Fall 2024. For more information about the school application process and admissions criteria, visit go.cps.edu.
Choice Patterns in the District
Reside & Attend in Home Region
Students that reside and attend school in their home region
Attend Out of Home Region
Students that attend school outside their home region
Enrollment by School Governance Type in the District
NOTE: Charter, Contract, and Alternative Learning Opportunity Program (ALOP) schools are public schools managed by independent operators and authorized by CPS. ALOP schools are a specific type of Options High School designed to provide educational support for students who face challenges to successfully graduating from a traditional high school.
Are Elementary School Students Choosing Schools in Their Region?
Elementary School Student Choice Over Time
School choice is currently defined as choosing to attend a school that is not a student’s zoned (or assigned) school.
Over the past four years, the percentage of elementary school students attending a school other than their zoned school (in or out of region) has decreased from 44% to 43% across the district. In the same time frame, the percentage of students attending their zoned school has increased from 56% to 57%.
The percentage of elementary school students attending a school in their home region (zoned or non-zoned) has stayed the same at 82%, while the percentage of students attending school out of region has also stayed the same at 18%.
Elementary School Student Attendance Type Over Time
Elementary School Student Attendance Type Over Time
NOTE: Only K-8 grade students are included in school choice calculations as Pre-K students are not zoned to a school. Due to rounding, some charts may not add up to 100%.
Elementary School Student Choice by Race/Ethnicity
School choice patterns tend to vary by race/ethnicity.
District-wide, 62% of elementary school students identifying as Latinx attend their zoned school compared to 46% of elementary school students identifying as Black, 69% of elementary school students identifying as White, and 63% of elementary school students identifying as Asian.
Elementary students identifying as Latinx attend school out of their home region at a rate of 17% compared to 22% of elementary school students identifying as Black, 13% of elementary school students identifying as White, and 19% of elementary school students identifying as Asian.
Students identifying as White or Latinx have the lowest percentage attending school out of their home region at 13% and 17% respectively.
Elementary School Student Attendance Type by Race/Ethnicity
Elementary School Student Attendance Type by Race/Ethnicity
NOTE: Due to rounding, some charts may not add up to 100%.
Elementary School Student Choice by Region
The Greater Lincoln Park (90%), Greater Midway (89%), and Pilsen / Little Village (88%) regions have the greatest percentage of students who attend school in their region (zoned or non-zoned). The Near West Side region has the lowest percentage at 63%.
| District-wide, 18% of elementary school students attend school out of the region where they live.
Elementary School Student Attendance Type by Region
Elementary School Student Attendance Type by Region
NOTE: Due to rounding, some charts may not add up to 100%.
Elementary School Student's Distance Traveled to School
These graphs show the median distance traveled for elementary school students who live in each region, regardless of whether they attend school in or out of their region. Travel data can be helpful in understanding the impact of choice patterns across regions. In general, shorter commutes can indicate that more or better school options are available within a region while longer commutes may mean that students are opting to travel greater distances to their school of choice.
District-wide, the median distance elementary students travel to school is 0.5 miles. 68% of elementary students travel less than 1 mile to school and 16% of students travel 3 miles or more to school.
Elementary School Students Median Distance Traveled To School By Region
Elementary School Students Average Distance Traveled To School By Region
There is significant variation in the distance traveled to school by region. 82% of elementary students residing in Pilsen / Little Village travel less than 1 mile to school compared to 54% of students in the West Side, Bronzeville / South Lakefront, and Central Area regions.
Elementary School Students Distance Traveled to School by Region
Elementary School Students Distance Traveled to School by Region
NOTE: The travel distance and time medians represent the midpoint in each group of data. The midpoint is the point where 50% of students in the region travel shorter than this distance/time and 50% travel longer than this distance/time. Using a median more fairly represents travel data and reduces the influence of extreme values such as students who attend school very far away from their home region.
Distance traveled and commute time are calculated based on the student’s home address and the address of their school. Commute distance and time was calculated using Google Maps travel estimates and includes a combination of walking and public transit data. The analysis takes into account school start times and chooses routes that minimize unnecessary travel and wait time. Any wait time before a trip starts is not included but wait times due to transfers are included.
Due to rounding, some charts may not add up to 100%.
Elementary School Student's Time Traveled to School
These graphs show the median commute time for elementary school students who live in each region, regardless of whether they attend school in or out of their region. Travel data can be helpful in understanding the impact of choice patterns across regions. In general, shorter commutes can indicate that more or better school options are available within a region while longer commutes may mean that students are opting to travel greater distances to their school of choice.
District-wide, the median time elementary students travel to school is 12 minutes. 61% of students travel less than 15 minutes to school and 7% of students travel 45 minutes or more to school.
Elementary School Students Median Time Traveled to School by Region
Elementary School Students Average Time Traveled to School by Region
There is significant variation in the time traveled to school by region. 80% of students residing in Pilsen / Little Village travel less than 15 minutes to school compared to 47% of students in the Central Area region.
Elementary School Students Time Traveled to School by Region
Elementary School Students Time Traveled to School by Region
NOTE: The travel distance and time medians represent the midpoint in each group of data. The midpoint is the point where 50% of students in the region travel shorter than this distance/time and 50% travel longer than this distance/time. Using a median more fairly represents travel data and reduces the influence of extreme values such as students who attend school very far away from their home region.
Distance traveled and commute time are calculated based on the student’s home address and the address of their school. Commute distance and time was calculated using Google Maps travel estimates and includes a combination of walking and public transit data. The analysis takes into account school start times and chooses routes that minimize unnecessary travel and wait time. Any wait time before a trip starts is not included but wait times due to transfers are included.
Due to rounding, some charts may not add up to 100%.
Elementary School Student's Distance Traveled to School by Race/Ethnicity
There is some variation in travel distances by race and ethnicity.
District-wide, 68% of elementary school students travel less than 1 mile to school. 73% of students identifying as White travel less than 1 mile to school compared to 72% of students identifying as Latinx, 60% of students identifying as Black, and 67% of students identifying as Asian.
11% of students identifying as White travel 3 miles or more to school compared to 22% of students identifying as Black, 18% of students identifying as Asian, and 14% of students identifying as Latinx.
Elementary School Students Distance Traveled to School by Race/Ethnicity
Elementary School Students Distance Traveled to School by Race/Ethnicity
NOTE: Due to rounding, some charts may not add up to 100%.
Elementary School Student's Time Traveled to School by Race/Ethnicity
There is also some variation in travel times by race and ethnicity.
District-wide, 61% of elementary school students travel less than 15 minutes to school. 66% of students identifying as Latinx travel less than 15 minutes to school compared to 55% of students identifying as Black, 61% of students identifying as Asian, and 64% of students identifying as White.
9% of students identifying as Black travel more than 45 minutes to school compared to 4% of students identifying as White and 6% of students identifying as Latinx or Asian.
Elementary School Students Time Traveled to School by Race/Ethnicity
Elementary School Students Time Traveled to School by Race/Ethnicity
NOTE: Due to rounding, some charts may not add up to 100%.
Are High School Students Choosing Schools in Their Region?
Percentage of 8th Grade Students Who Applied to High School
Currently, CPS uses the GoCPS platform to assist students and families in researching and applying to high schools and high school programs across the district. Students are asked to rank in order of preference the schools and programs they are most interested in. Students are guaranteed a seat in the general education program at their zoned high school and are not required to submit an application to attend there. For more information about GoCPS and the high school application process, visit go.cps.edu.
District-wide, 92% of all 8th-grade CPS students applied to high school programs in Round 1 of the GoCPS application process. Pilsen / Little Village (97%), Greater Milwaukee Avenue (95%), Greater Midway (95%), Northwest Side (95%), and Greater Stockyards (95%) regions had the greatest application rates while the Far Northwest Side (85%) region had the lowest.
Percent of 8th Grade Students Who Applied to High School by Region
Percent of 8th Grade Students Who Applied to High School by Region
NOTE: Due to rounding, some charts may not add up to 100%.
Percentage of 8th Grade Students Who Received an Offer from One of Their Top 3 Choices
Of all 8th-grade CPS students who applied to high school programs in Round 1, 87% received an offer from one of their top three choices. The Pilsen / Little Village (92%) region had the greatest percentage of students who received an offer from one of their top three choices while the Greater Midway (81%) region had the least. This data does not include selective enrollment high schools as those schools use a different ranking process in GoCPS.
Percent of 8th Grade Students Who Received an Offer from One of Their Top 3 Choices by Region
Percent of 8th Grade Students Who Received an Offer from One of Their Top 3 Choices by Region
NOTE: This analysis only includes 8th-grade applicants who were enrolled on the 20th day of school in 2024-25. Due to rounding, some charts may not add up to 100%.
High School Student Choice Over Time
School choice is currently defined as choosing to attend a school that is not a student’s zoned (or assigned) school.
Over the past four years, the percentage of high school students attending a school other than their zoned school (in or out of region) has decreased from 76% to 75% across the district. In the same time frame, the percentage of students attending their zoned school has stayed the same at 25%.
The percentage of high school students attending a school in their home region (zoned or non-zoned) has increased from 56% to 57% while the percentage of students attending another school out of region has decreased from 45% to 43% across the district.
High School Student Attendance Type Over Time
High School Student Attendance Type Over Time
NOTE: Due to rounding, some charts may not add up to 100%.
High School Student Choice by Race/Ethnicity
School choice patterns tend to vary by race/ethnicity.
District-wide, 30% of high school students identifying as Latinx attend their zoned school compared to 17% of high school students identifying as Black, 30% of high school students identifying as White, and 25% of high school students identifying as Asian.
High school students identifying as Latinx attend school out of their home region at a rate of 38% compared to 49% of high school students identifying as Black, 41% of high school students identifying as White, and 45% of high school students identifying as Asian.
Students identifying as Latinx or White have the lowest percentage attending school out of their home region at 38% and 41% respectively.
High School Student Attendance Type by Race/Ethnicity
High School Student Attendance Type by Race/Ethnicity
NOTE: Due to rounding, some charts may not add up to 100%.
High School Student Choice by Region
District-wide, more than twice as many high school students (43%) attend school out of their home region compared to elementary students (18%). The Northwest Side region has the greatest percentage of high school students who attend school in their region (zoned or non-zoned) at 78% and the Greater Milwaukee Avenue and Greater Stony Island regions have the lowest percentage at 38%.
| District-wide, 43% of high school students attend school out of the region where they live.
High School Student Attendance Type by Region
High School Student Attendance Type by Region
NOTE: Due to rounding, some charts may not add up to 100%.
High School Student's Distance Traveled to School
These graphs show the median distance traveled for high school students who live in each region, regardless of whether they attend school in or out of their region. Travel data can be helpful in understanding the impact of choice patterns across regions. In general, shorter commutes can indicate that more or better school options are available within a region while longer commutes may mean that students are opting to travel greater distances to their school of choice
District-wide, the median distance high school students travel to school is 2.6 miles. 21% of students travel less than 1 mile to school and 46% of students travel 3 miles or more to school.
High School Students Median Distance Traveled to School by Region
High School Students Average Distance Traveled to School by Region
There is significant variation in the distance traveled to school by region. 29% of students residing in the North Lakefront region travel less than 1 mile compared to 10% of students in the Greater Stony Island region.
High School Students Distance Traveled to School by Region
High School Students Distance Traveled to School by Region
NOTE: The travel distance and time medians represent the midpoint in each group of data. The midpoint is the point where 50% of students in the region travel shorter than this distance/time and 50% travel longer than this distance/time. Using a median more fairly represents travel data and reduces the influence of extreme values such as students who attend school very far away from their home region.
Distance traveled and commute time are calculated based on the student’s home address and the address of their school. Commute distance and time was calculated using Google Maps travel estimates and includes a combination of walking and public transit data. The analysis takes into account school start times and chooses routes that minimize unnecessary travel and wait time. Any wait time before a trip starts is not included but wait times due to transfers are included.
Due to rounding, some charts may not add up to 100%.
High School Student's Time Traveled to School
These graphs show the median commute time for high school students who live in each region, regardless of whether they attend school in or out of their region. Travel data can be helpful in understanding the impact of choice patterns across regions. In general, shorter commutes can indicate that more or better school options are available within a region while longer commutes may mean that students are opting to travel greater distances to their school of choice.
District-wide, the median time high school students travel to school is 26 minutes. 19% of students travel less than 15 minutes to school and 17% of students travel 45 minutes or more to school.
High School Students Median Time Traveled to School by Region
High School Students Average Time Traveled to School by Region
There is significant variation in the time traveled to school by region. 26% of students residing in the Bronzeville / South Lakefront region travel less than 15 minutes compared to 11% of students in the South Side region.
High School Students Time Traveled to School by Region
High School Students Time Traveled to School by Region
NOTE: The travel distance and time medians represent the midpoint in each group of data. The midpoint is the point where 50% of students in the region travel shorter than this distance/time and 50% travel longer than this distance/time. Using a median more fairly represents travel data and reduces the influence of extreme values such as students who attend school very far away from their home region.
Distance traveled and commute time are calculated based on the student’s home address and the address of their school. Commute distance and time was calculated using Google Maps travel estimates and includes a combination of walking and public transit data. The analysis takes into account school start times and chooses routes that minimize unnecessary travel and wait time. Any wait time before a trip starts is not included but wait times due to transfers are included.
Due to rounding, some charts may not add up to 100%.
High School Student's Distance Traveled to School by Race/Ethnicity
There is some variation in travel distances by race and ethnicity.
District-wide, 55% of high school school students travel less than 3 miles to school. 61% of students identifying as Latinx travel less than 3 miles to school compared to 47% of students identifying as Black, 49% of students identifying as Asian, and 53% of students identifying as White.
24% of students identifying as Black travel 6 miles or more to school compared to 14% of students identifying as Latinx, 15% of students identifying as White, and 18% of students identifying as Asian.
High School Students Distance Traveled to School by Race/Ethnicity
High School Students Distance Traveled to School by Race/Ethnicity
NOTE: Due to rounding, some charts may not add up to 100%.
High School Student's Time Traveled to School by Race/Ethnicity
There is also some variation in travel times by race and ethnicity.
District-wide, 59% of high school students travel less than 30 minutes to school. 64% of students identifying as Latinx travel less than 30 minutes to school compared to 53% of students identifying as Black, 54% of students identifying as Asian, and 56% of students identifying as White.
22% of students identifying as Black travel more than 45 minutes to school compared to 16% of students identifying as Latinx, 16% of students identifying as White, and 19% of students identifying as Asian.
High School Students Time Traveled to School by Race/Ethnicity
High School Students Time Traveled to School by Race/Ethnicity
NOTE: Due to rounding, some charts may not add up to 100%.
Are Options High School Students Choosing Schools in Their Region?
Options High School Student Choice Over Time
Options high schools serve students who need a new pathway toward high school graduation. CPS schools offer additional supports and services for students who have been out of school and seek to return or who may need opportunities to earn credits in an accelerated program. Some of CPS’ campuses offer additional supports such as counseling and alternative schedules for students who may work during the traditional school day.
Options high schools exist in every region except the Greater Lincoln Park and Far Southwest Side regions. Options high schools do not have attendance zones or admission criteria although many serve only students 16 years and older. Students can choose to attend any Options high school within or outside of their home region. For this reason, Choice patterns tend to differ for Options students compared to elementary and other high school students.
Over the past four years, the percentage of Options high school students attending a school in their region has increased from 39% to 40%. District-wide, Options high school students attend school out of region at a greater rate than elementary and other high school students.
Options High School Student Attendance Type Over Time
Options High School Student Attendance Type Over Time
NOTE: Due to rounding, some charts may not add up to 100%.
Options High School Student Choice by Region
District-wide, a greater percentage of Options high school students attend school out of region than both other high school and elementary students. The Far Southwest Side and Greater Lincoln Park regions both have the greatest percentage of students attending school out of region at 100% because there are no Options high schools in those regions. For regions where an in-region Options high school exists, the Greater Milwaukee Avenue (67%) and Greater Calumet (61%) regions have the greatest percentage of students attending an in-region Options high school.
Options High School Student Attendance Type by Region
Options High School Student Attendance Type by Region
NOTE: Due to rounding, some charts may not add up to 100%.
Options High School Students' Distance Traveled to School
This graph shows the median distance traveled for Options high school students who live in each region, regardless of whether they attend school in or out of the region. Travel data can be helpful in understanding the impact of choice patterns across regions. In general, shorter commutes can indicate that more or better school options are available within a region while longer commutes may mean that students are opting to travel greater distances to their school of choice.
District-wide, the median distance Options high school students travel to school is 3.4 miles. The regions with the shortest median commute are Greater Milwaukee Avenue (1.5 miles), Greater Stockyards (2.0 miles), and Far Southwest Side (2.2 miles). The regions with the furthest median commute are Bronzeville / South Lakefront (5.4 miles), North Lakefront (5.3 miles), and Central Area (4.7 miles).
District-wide, 12% of Options high students travel less than 1 mile to school and 56% of students travel 3 miles or more.
Options High School Students Median Distance Traveled to School by Region
Options High School Students Average Distance Traveled to School by Region
Options High School Students Distance Traveled to School by Region
Options High School Students Distance Traveled to School by Region
NOTE: The travel distance and time medians represent the midpoint in each group of data. The midpoint is the point where 50% of students in the region travel shorter than this distance/time and 50% travel longer than this distance/time. Using a median more fairly represents travel data and reduces the influence of extreme values such as students who attend school very far away from their home region.
Distance traveled and commute time are calculated based on the student’s home address and the address of their school. Commute distance and time was calculated using Google Maps travel estimates and includes a combination of walking and public transit data. The analysis takes into account school start times and chooses routes that minimize unnecessary travel and wait time. Any wait time before a trip starts is not included but wait times due to transfers are included.
Due to rounding, some charts may not add up to 100%.
Options High School Students' Time Traveled to School
This graph shows the median time traveled for Options high school students who live in each region, regardless of whether they attend school in or out of the region. Travel data can be helpful in understanding the impact of choice patterns across regions. In general, shorter commutes can indicate that more or better school options are available within a region while longer commutes may mean that students are opting to travel greater distances to their school of choice.
District-wide, the median distance Options high school students travel to school is 29 minutes. The regions with the shortest median commute time are Greater Milwaukee Avenue (19 minutes), Greater Stockyards (20 minutes), and Far Southwest Side and Pilsen / Little Village (22 minutes). The regions with the longest median commute time are North Lakefront and Bronzeville / South Lakefront (37 minutes) and Far Northwest Side (36 minutes).
District-wide, 51% of Options high school students travel less than 30 minutes to school and 21% of students travel 45 minutes or more.
Options High School Students Median Time Traveled to School by Region
Options High School Students Average Time Traveled to School by Region
Options High School Students Time Traveled to School by Region
Options High School Students Time Traveled to School by Region
NOTE: The travel distance and time medians represent the midpoint in each group of data. The midpoint is the point where 50% of students in the region travel shorter than this distance/time and 50% travel longer than this distance/time. Using a median more fairly represents travel data and reduces the influence of extreme values such as students who attend school very far away from their home region.
Distance traveled and commute time are calculated based on the student’s home address and the address of their school. Commute distance and time was calculated using Google Maps travel estimates and includes a combination of walking and public transit data. The analysis takes into account school start times and chooses routes that minimize unnecessary travel and wait time. Any wait time before a trip starts is not included but wait times due to transfers are included.
Due to rounding, some charts may not add up to 100%.
Options High School Students Residing and Enrolling Map and Table
| District-wide, 6% of high school students are enrolled in an Options high school.
This map illustrates where 9th-12th Options high school students reside across the district and where Options schools are located. The table shares enrollment data on Options high schools students across all regions.
Map of Options High School Locations and Where Options High School Students Reside and Attend
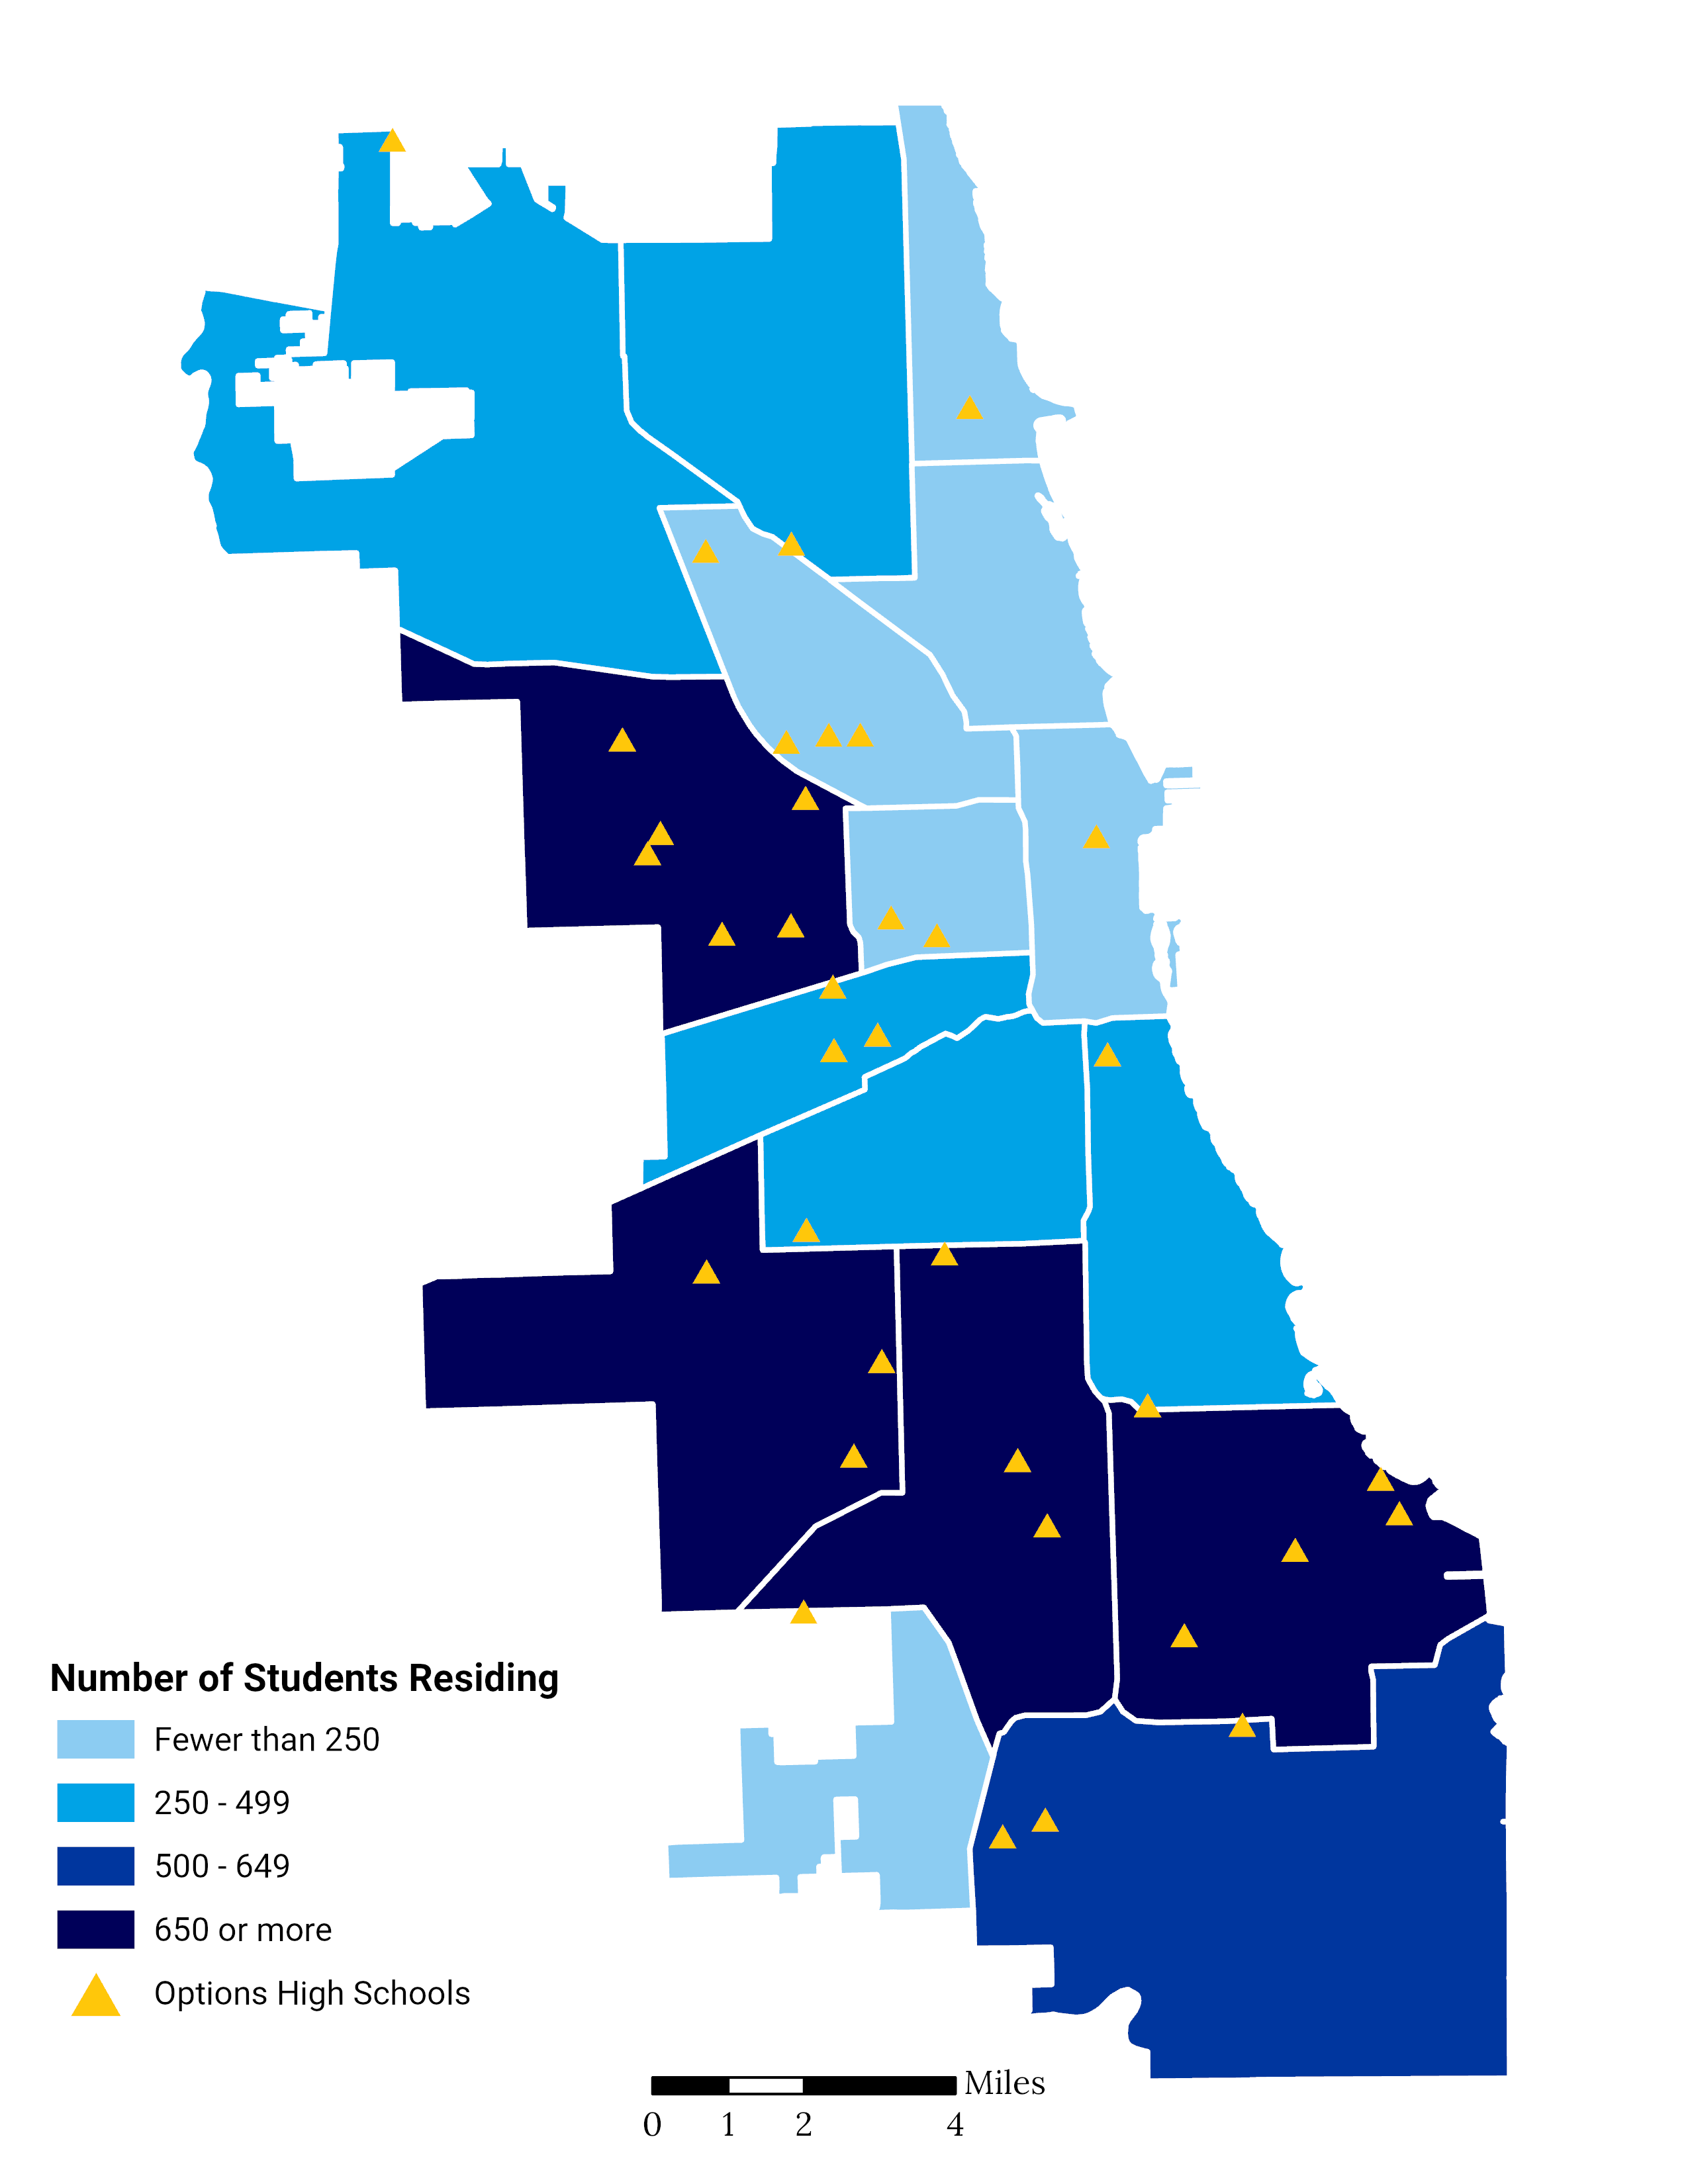
NOTE: Share of Options high school students by region is provided to show the proportion of HS students who attend an Options high school compared to all HS students who reside in that region.
Options high school students can attend school in or out of the region except for in the Far Southwest Side and Greater Lincoln Park regions which do not contain Options high schools.
Options high schools do not have attendance zones or admission criteria although many serve only students 16 years and older.
Options High School Students by Region