Chicago Public Schools Releases Attendance Rates for In-Person and Virtual Learning
19 March 2021
Preliminary Dataset Shows Increase in School-Based Attendance Rate the Longer in-person Learning is in Session; Average Districtwide Attendance Rate for In-Person Learning is 73 Percent Between March 8 and March 12
CHICAGO – Chicago Public Schools (CPS) today announced that an average of 73 percent of students who were expected to attend in person at district schools between March 8 and March 12 were in attendance, with the daily attendance rate increasing the longer schools have been open. Pre-k and students enrolled in cluster programs saw the largest gains in the school-based attendance rate, starting with 55 percent on February 11 to 69 percent on March 12, with a high of 74 percent on March 9.
“While in-person attendance rates aren’t comparable to pre-pandemic levels, the district is encouraged to see an increase in school-based attendance the longer students have that option available, especially among our youngest learners and students in cluster programs,” said CPS CEO Dr. Janice K. Jackson. “Schools offer children a stable learning environment, and we look forward to welcoming additional students back to the classroom on April 19.”
The district’s attendance release includes data by grade corresponding to when the student group phased in between February 11 — the first day of in-person learning for pre-k and students enrolled in cluster programs after the agreement was reached with the Chicago Teachers Union (CTU) — and March 12, when students in grades 6-8 were able to return to in-person learning (a link to attendance data on the first week of school for January 11 can be found here). Data from pre-k and students enrolled in cluster programs represent the most complete picture of attendance progress since they have been in school the longest, while grades K-5 represent two weeks and grades 6-8 represent one week of data. Of the 59,302 students expected to appear in-person as of March 12, 49,281 attended in-person learning at least one day between February 11 and March 12.
Increase Over Time
As more grades were phased in and the longer the in-person learning option was available, attendance rates for in-person learning have increased for pre-k and cluster program students and grades K-5. The data below represents four days of data for grades 6-8 and therefore, represents the least complete data overview.
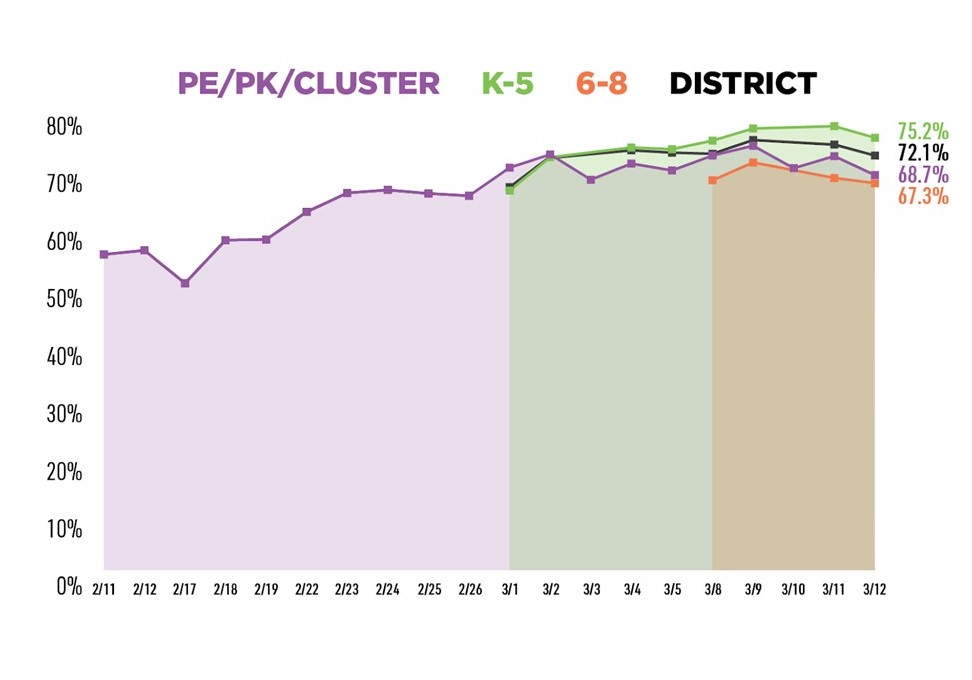
The district’s daily attendance rate also increased on each subsequent start date:
- February 11 (pre-k & cluster): 55 percent
- March 1 (K-5): 67 percent
- March 8 (6-8): 72 percent
The graphic includes student groups’ daily attendance and their progression between February 11 and March 12. The February 16 snow day and Wednesdays were excluded for grades K-8 because they are on a hybrid schedule in which they do not attend in-person learning on Wednesdays. A link to the full data can be found at the bottom of this document.
Breakdown By Grade Group
At the district level, the average in-person attendance rate was 73 percent across all grades and student groups eligible for in-person learning during the week of March 8—March 12, while the attendance rate of those expected to learn from home was 93 percent. The district is unable to complete an analysis of district-wide attendance average with in-person differentiation from February 11 — March 12 because students groups had different start times, making averaging over the entirety of the time period not possible, as the average depends on dividing by the number of days. Each student group attendance average outlined below is based on the period of time the student group was in attendance.
|
Expected-In Person |
Expected Virtually |
|
|---|---|---|
|
District-Wide (March 8-March 12) |
In-Person: 73 Percent Virtual: 21 Percent Absent: 6 Percent |
In-Person: 0 Percent Virtual: 93 Percent Absent: 7 Percent |
|
Pre-K & Cluster (February 11 — March 12) |
In-Person: 65 Percent Virtual: 23 Percent Absent: 12 Percent |
In-Person: 0 Percent Virtual: 86 Percent Absent: 13 Percent |
|
Grades K-5 (March 1 — March 12) |
In-Person: 74 Percent Virtual: 21 Percent Absent: 5 Percent |
In-Person: 0 Percent Virtual: 93 Percent Absent: 6 Percent |
|
Grades 6-8 (March 8-March 12) |
In-Person: 69 Percent Virtual: 27 Percent Absent: 5 Percent |
In-Person: 0 Percent Virtual: 94 Percent Absent: 6 Percent |
Data and Methodology
When entering attendance data, schools have three options: attended in-person, attended virtually or absent. To calculate attendance averages, the students’ attendance status was compared to their “shift” — the learning method they were expected to use for that specific day. For example, non-pre-k and cluster program students learn remotely on Wednesdays, therefore, students aren’t expected to appear in schools on that day, whereas the vast majority of pre-k and students enrolled in cluster programs attend in-person five days a week. The denominators in the overview represent the average number of those expected to appear on any given day and therefore, is not representative of how many students have opt-ed in.
It is important to note that this data does not align to learner preference model data, rather, it is aligned to shift data. Upon receiving learner preferences, schools assigned students to a “shift schedule” — their attendance is tied to the shift they are assigned (i.e. attending M-F, M-Tu, etc.) and they are no longer identified simply by whether they selected in-person or at home learning. Further, changes are made at the school level, for example, on a case-by-case basis if a principal felt they had sufficient staffing, they were able to manually change a students’ shift, or if a parent decides to no longer participate in in-person learning.
Links to a full district wide and demographic breakdown, a school-level spreadsheet, and accompanying data for the day-by-day outlook are included below:
- Link to average attendance calculation
- Link to school-level spreadsheet
- Daily in-person attendance rates
Chicago Public Schools serves 341,000 students in 638 schools. It is the nation’s third-largest school district.