Update (11/5/2019)
The text below reflects the FY2020 original budget that was approved by the Board of Education on August 28, 2019. For details on the FY2020 amended budget, please follow this link. Additionally, the amended budget information is reflected in the Interactive Reports feature found on the left-hand toolbar.
However, this improved financial outlook still does not elevate the district’s revenue collection enough for our students to receive all the resources they need and deserve. In particular, CPS will still require $1,924 million more in FY2020 state funding to fully fund our schools according to the Illinois State Board of Education’s own EBF formula.
It is critical that state lawmakers work toward fully funding the EBF formula to protect the hard-earned, equitable improvements to education funding. Although Chicago is experiencing significant growth in property values, CPS’ ability to raise revenue locally from property taxes — and total education levy collections — are effectively limited to the rate of inflation for the vast majority of CPS’ property tax levy.
| FY2019 Budget |
FY2019 Projected End of Year |
FY2020 Budget |
FY2020 vs. FY2019 Budget |
|
|---|---|---|---|---|
| Local Revenues | ||||
| Property Tax | $2,984.3 | $3,037.8 | $3,134.5 | $150.2 |
| Replacement Tax | $161.1 | $187.3 | $215.3 | $54.2 |
| Other Local | $381.6 | $311.3 | $457.1 | $75.5 |
| Total Local | $3,527.0 | $3,536.4 | $3,806.9 | $279.9 |
| State Revenues | ||||
| EBF | $1,646.3 | $1,605.8 | $1,673.7 | $27.4 |
| Capital | $15.3 | $15.3 | $32.4 | $17.1 |
| Other State | $530.8 | $515.8 | $575.6 | $44.8 |
| Total State | $2,192.4 | $2,136.9 | $2,281.8 | $89.3 |
| Federal | $836.7 | $786.7 | $767.5 | $(69.2) |
| Investment Income | $5.0 | $5.7 | $5.0 | $0.0 |
| Total Revenue | $6,561.1 | $6,465.7 | $6,861.2 | $300.1 |
Table 2 illustrates how CPS revenues are distributed into operating, debt service, and capital funds. Although the total revenues are $6.9 billion in FY2020, only $6.1 billion are available for operations.
| Total | Amount for Debt Service |
Amount for Capital |
Balance for Operating Budget |
|
|---|---|---|---|---|
| Local Revenues | ||||
| Property Tax | $3,134.5 | $51.1 | $9.6 | $3,073.8 |
| Replacement Tax | $215.3 | $64.3 | $0.0 | $151.0 |
| Other Local | $457.1 | $142.3 | $25.2 | $289.7 |
| Total Local | $3,806.9 | $257.7 | $34.8 | $3,514.4 |
| State Revenues | ||||
| EBF | $1,673.7 | $382.0 | $0.0 | $1,291.8 |
| Capital | $32.4 | $0.0 | $32.4 | $0.0 |
| Other State | $575.6 | $0.0 | $0.0 | $575.6 |
| Total State | $2,281.8 | $382.0 | $32.4 | $1,867.4 |
| Federal | $767.5 | $24.7 | $10.1 | $732.7 |
| Investment Income | $5.0 | $0.0 | $0.0 | $5.0 |
| Total Revenue | $6,861.2 | $664.4 | $77.2 | $6,119.6 |
Revenue Projections
This section summarizes the district’s major revenue sources and each source’s projected FY2020 revenue. Additional details about each revenue source is provided in the Interactive Budget on the CPS budget website: cps.edu/budget.
FY2020 operating revenues are budgeted at $6,120 million, an increase of $198 million from our FY2019 budget and $219 million more than our FY2019 estimated end-of-year operating revenues.
| FY2019 Operating Budget |
FY2019 Estimated End of Year |
Variance Estimated vs Budget |
FY2020 Operating Budget |
FY2020 vs. FY2019 Budget |
|
|---|---|---|---|---|---|
| Property Tax | $2,899.4 | $2,952.9 | $53.5 | $3,073.8 | $174.4 |
| Replacement Tax | $126.2 | $152.3 | $26.2 | $151.0 | $24.8 |
| TIF Surplus | $22.3 | $96.9 | $74.6 | $96.9 | $74.6 |
| All Other Local | $214.2 | $143.9 | $(70.3) | $192.8 | $(21.4) |
| Total Local | $3,262.1 | $3,346.1 | $84.0 | $3,514.4 | $252.3 |
| State | $1,610.3 | $1,554.8 | $(55.5) | $1,610.1 | $(0.2) |
| State Pension Support | $238.9 | $238.9 | $0.0 | $257.3 | $18.5 |
| Federal | $805.4 | $755.4 | $(50.0) | $732.7 | $(72.6) |
| Investment Income | $5.0 | $5.7 | $0.7 | $5.0 | $0.0 |
| Total Revenue | $5,921.6 | $5,900.8 | $(20.8) | $6,119.6 | $197.9 |
Local Revenues
Property Taxes
CPS is projected to receive $3,135 million in property tax revenues in FY2020, which remains the district’s largest single revenue source. Property taxes will make up 50.2 percent of all operating revenues, up from 49.0 percent in FY2019. Of the total property tax revenue, $51 million is restricted for paying off Capital Improvement debt, $10 million is allocated to other capital needs, and $477 million is projected as revenue from the dedicated Chicago Teachers’ Pension Fund (CTPF) levy. This leaves $2,597 million left for all other operating costs, an increase of $127 million from the FY2019 budget.
The $127 million increase includes $39 million from increasing the education levy by the rate of inflation of 1.9 percent1, which is the announced national inflation rate as of December 2018; $17 million generated from the $712 million in new property that is projected to be included in the 2019 tax bill; $67 million from the Red-Purple Modernization Phase One Transit Tax Increment Financing (Transit TIF); and $4 million in the projected 2 percent increase in assessed value growth. There is currently no levy backing the issuance of Public Building Commission (PBC) bonds, which decreases the property tax debt service budget by $31 million from FY2019.
FY2020’s increased budget for property tax revenues primarily reflects the impact of slightly larger-than-expected assessment increases in FY2019, after the Cook County Assessor’s office re-assessed properties within Chicago for the first time since 2015 and the City Council passed an unanticipated sunset of five separate TIF districts in December 2018. The FY2019 budget assumed an 11 percent growth in the value of pre-existing properties, and actual increases were slightly higher at 11.2 percent, the largest annual growth rate since 2007.2
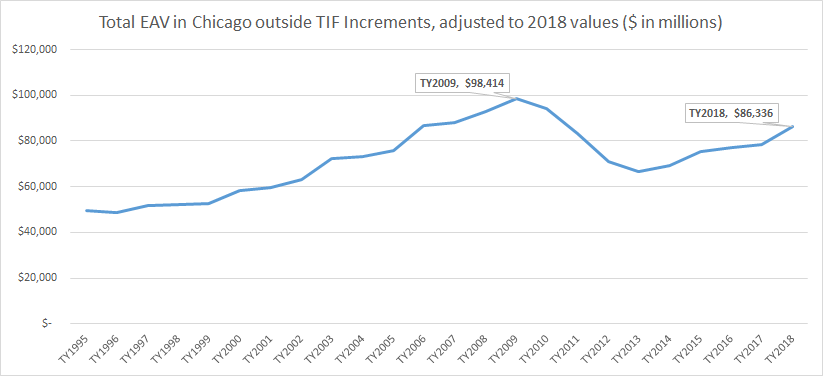
Property value in the city outside of TIF districts was $86.3 billion in 2018, representing the first time that valuations in Chicago exceeded $84 billion since 2010. However, adjusted for inflation (Chart 1), property values in 2018 are still 12.3 percent lower than their 2009 peak before the Great Recession. In the context of this improvement, Chicago taxpayers face a modest tax rate of 3.552 percent on the equalized assessed values of their properties, which is the lowest tax rate since 2015.
Chart 1: Total EAV in Chicago outside TIF Incremental Value, TY1995-2018
Four factors will primarily determine property tax performance for CPS over the next three years.
First, the slight increase in property tax valuations in the current 2018 reassessment will serve as the baseline for the next two fiscal years. It is not certain how the assessment and appeal reforms that will be implemented by the new administration of the Cook County Assessor’s office and in the Cook County Property Tax Appeal Board (PTAB) will impact Chicago’s property tax growth in 2021, the next time that properties in the city will be reassessed.
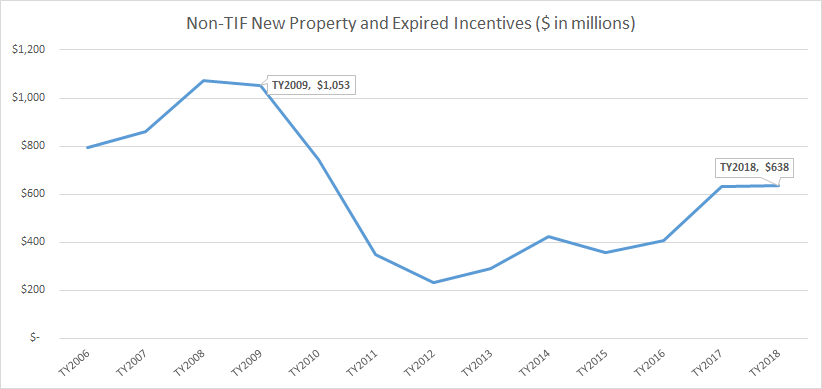
Second, assuming that inflation remains at its long-term average of around 2 percent, the biggest determinant of CPS’ property tax revenues is the amount of new property that is constructed in the city. New property construction outside of TIF districts has not recovered to pre-recession standards, and 2018 construction was valued at 40.6 percent lower than the pre-recession peak in 2008, unadjusted for inflation. (Chart 2)
If new construction were level with 2009 levels, non-pension operating revenues in FY2020 would be projected to increase by over $10 million. Continued new construction in Chicago will also drive down tax rates for all other city residents. In FY2020, CPS projects that there will be $712 million of new property, a 12 percent increase from FY2019.
Chart 2: Non-TIF New Property in Chicago, Tax Years 2006-2018
Third, when a TIF district expires, any incremental value over the frozen value when the TIF district was first created counts as ‘new property,’ indistinguishable in its effects on CPS from other construction that happened in the current tax year. In 2018, the City Council passed legislation that terminated five TIF districts well ahead of their scheduled sunsets3. Together with two other TIF districts that were scheduled to be sunset at the end of 2018, the increments in these TIF districts were worth $320 million, just over half of all other new construction. There is currently only one TIF district that is scheduled to sunset in FY2020 with an increment of $2.9 million, and CPS will be impacted by any potential changes to the way that TIF districts are currently governed. Because CPS levies are constrained by inflation rather than total property value, CPS is not materially harmed from the future creation of any new TIF districts.
Lastly, a growing proportion of all CPS operating revenues is generated by the TIF district created for the Red-Purple Modernization Program (Transit TIF) on the North side of Chicago to modernize Chicago Transit Authority (CTA) tracks from North Avenue to Devon Avenue. By statute, CPS is due approximately 52 percent of all incremental value produced in the Transit TIF4, and per projections produced by the Cook County Clerk in 20195, CPS should generate $143 million in Transit TIF by 2030. Chicago’s North side near the lakefront experienced strong property value growth in the 2018 reassessment as compared to the rest of the city, with properties within Transit TIF boundaries increasing in value by 17.9 percent compared to a citywide average of 11.2 percent. CPS will benefit if property growth within the boundaries of the Transit TIF continues in future assessment years.
The effect of increased 2018 assessments on individual, commercial, and industrial taxpayers was tempered by the Property Tax Extension Limitation Law (PTELL). Since 1994, CPS has been one of over 450 school districts in the state whose education levy is not primarily determined by property value, but instead by the total levy from the previous year. Under PTELL, increases in property tax extensions are limited to the lesser of five percent or to the national increase in inflation in the year preceding the levy year. The money that CPS raises from the education levy for FY2020 is therefore the final extension for FY2019, multiplied by the finalized 2018 inflation rate of 1.9 percent6. Given that the inflation rate is lower than the city-wide increase in assessments of 11.2 percent, individual property tax rates for CPS went down from 3.89 percent in FY2018 to 3.55 percent in FY2019.
The pension property tax levy dedicated to funding CPS employer contribution costs to CTPF is not subject to PTELL, and is instead equal to a flat 0.567 percent applied to the prior year’s base value and the current year’s new property value. Further discussion of this revenue stream can be found in the Pensions chapter.
Like other government bodies, CPS has a 60-day revenue recognition period. This allows the district to recognize FY2019-budgeted revenues received prior to August 29, 2019, as FY2019 revenues, and shifts our fiscal year revenues to be in line with the year in which property taxes are collected.
Personal Property Replacement Taxes (PPRT)
PPRT revenue is budgeted to increase from $161 million in FY2019 to $215 million in FY2020. This increase reflects how actual PPRT revenues in FY2019 were $187 million, $26 million over budget, largely because corporate tax collection in Illinois continues to grow at a robust pace. This figure includes $64.3 million set aside for debt service and leaves $151.0 million for operating purposes, which is $24.8 million higher than FY2019. Debt service costs backed by PPRT are higher in FY2020 compared to FY2019 by $29 million.
Replacement taxes “replace” money that was lost by local governments when their powers to impose personal property taxes on corporations, partnerships, and other business entities were taken away by state legislation in the 1970s. The tax is currently imposed at a rate of 2.5 percent of federal taxable income for corporations, and 1.5 percent of federal taxable income for partnerships, trusts, and Subchapter S corporations.
The state collects and distributes PPRT to local taxing districts. Taxing districts in Cook County receive 51.7 percent of collections, which is divided among the county’s taxing bodies based on each district’s share of personal property collections in 1976. CPS receives 27.1 percent of the total Cook County share, which is equivalent to 14.0 percent of the statewide total.
The PPRT includes an additional state income tax on corporations and partnerships, a tax on businesses that sell gas or water, a 0.5 percent fee on all gross charges for telecommunications services excluding wireless services, and a per-kilowatt tax on electricity distributors. The primary driver of PPRT is corporate income tax receipts, which are closely tied to corporate profits.
Corporate profits have steadily improved since 2015 in a climate of generally improving economic performance throughout the state and the country, thereby increasing gross corporate income tax receipts collected by the state of Illinois.
A portion of the state’s total corporate income taxes are first deposited into a Refund Fund to pay business income tax refunds. The size of that portion is determined by the Illinois Department of Revenue (IDOR), based on the size of revenues and business demand for refunds. In FY2019, that refund rate was 15.5 percent of all corporate income tax collections, leaving the remaining 84.5 percent to be largely disbursed to local governments.7
According to the state budget that was signed by Governor Pritzker on June 6, 2019, the refund rate will decline to 14.75 percent, meaning that CPS and other local governments will see a small bump in the amount they receive in PPRT revenues. Additionally, total corporate tax receipts are projected in the state budget to increase by 0.8 percent in FY2020 because of growing corporate profits.
Per the state’s own PPRT projections, CPS and other local governments throughout the state of Illinois will receive one-time revenue bumps in FY2020. Factors causing this increase include a transfer of $32 million from corporate income tax funds to PPRT funds, a transfer of $96 million from Income Tax Refund funds to PPRT funds because deposits into the Refund Fund are projected to exceed the amounts paid out for refunds, and a decrease in the federal tax rate on foreign-derived intangible income.8 None of these changes structurally change Illinois’ economic outlook.
PPRT is a volatile revenue source, and is dependent on Illinois and the United States not slipping into a recession that negatively impacts corporate profits in FY2020.
TIF Surplus and Other Local Resources
Since the beginning of the TIF program, CPS has received more than $1.3 billion in TIF funds for capital investments in schools throughout the city9. Since FY2018, $68.3 million in TIF-funded projects provided renovations and improvements at 13 unique schools. $13 million of TIF money will be spent on four school projects in FY2020.
CPS expects to receive $96.9 million in TIF surplus funding in FY2020. TIF surpluses are one-time actions that when declared, allow for accumulated reserves to be distributed to local governments on a proportional basis. Per Executive Order 2013-3, which is still active, the City of Chicago is committed to declaring a TIF surplus in districts that are older than three years, were not created for a single redevelopment project, do not support debt service costs on Modern Schools Across Chicago (MSAC) bonds, and have a balance of at least $1 million.
“All other local” revenue includes the pension payment made by the City of Chicago to the Municipal Employees’ Annuity and Benefit Fund (MEABF), which is estimated to be $60 million in FY2020. It is recorded as revenue as required by the Governmental Accounting Standards Board (GASB).
Local Contributions to Capital
FY2020 local capital revenue of $34.6 million includes $13 million in Tax Increment Financing (TIF)-related project reimbursements and $21.6 million from other local funding sources such as aldermanic funds, and the water reclamation district.
State Revenue
In FY2020, $1.87 billion in state funding will comprise 31 percent of CPS’ total operating budget. The majority of that figure comes from the statewide Evidence-Based Funding (EBF) model which, beginning in FY2018, has been used to disburse money based on need to each school district in the state of Illinois . In addition, the state supplements the EBF disbursement with categorical grants that support specific initiatives within school districts, including transportation and early childhood education.
Evidence-Based Funding
The EBF model of state education funding is now in its third year of implementation, replacing the old General State Aid (GSA) formula. While the EBF model has contributed to CPS’ improved financial standing, it is still does not sufficiently close the district’s deficit.
In FY2020, CPS projects that it will receive a total of $1,657 million in EBF money from the state. This includes a $64 million increase in tier money from the state budget in FY2019 and $4 million in decreased diversions to fund five charter schools authorized by the Illinois State Charter School Commission (SCSC). It is important to note that because EBF actual revenues in FY2019 were $41 million lower than what was budgeted, the FY2020 EBF increased $27 million from the FY2019 budget — not $68 million.
Of the $1,657 million, $382 million will be used to back debt service issuances. CPS projects to receive $16.3 million in adjustments to prior year EBF and GSA revenues when property values were reduced after revenues were already disbursed to CPS.
Under current law, CPS’ EBF allocation cannot decrease from year to year. CPS receives the prior year EBF allocation (FY2019), which totals $1.619 billion, as the current year Base Funding Minimum (BFM). Any money appropriated over the BFM is referred to as tier money, as it is distributed according to a district’s standing in one of four tiers. Tier 1 districts like CPS are the neediest in the state and receive funding that is equal to half of all new funding. Total tier funding for CPS in FY2020 will be $64.3 million.
According to the state budget (Public Act 101-0007), funding for districts in all four tiers is equal to $375 million. $50 million of that $375 million is dedicated to the Property Tax Relief Fund, designed to lessen the property tax burden for residents living in high-tax areas. CPS is not able to access these funds because our operating tax rate is 3.27 percent of city property value, well below the state-wide average of 3.73 percent. An additional $12.4 million is diverted to be included in the base funding minimum for Regional Offices of Education (ROEs) for the first time, per Public Act 101-0010. This leaves $312 million allocated to tier money that is actually distributed to low-tax districts like CPS.
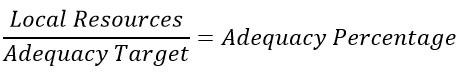
Since the implementation of EBF in FY2018, CPS has remained a Tier 1 district. These four tiers are determined based on the percentage of an Adequacy Target that a school district is able to fulfill with local resources in a given fiscal year. Adequacy Targets are determined by the cost of providing each student with core investments such as teachers, guidance counselors, nurses, and librarians, and account for additional support for limited-income students, English Learners, and students with disabilities. CPS has a FY2020 Adequacy Target of $5.59 billion, equivalent to $15,531 of spending per student.
However, with current levels of resources, which combine the BFM, operating revenue from property taxes, and PPRT, CPS only meets a projected $3.66 billion of that $5.59 billion target — or 65.6 percent adequacy. CPS will remain a Tier 1 district in FY2020 because our Adequacy percentage is lower than the 67.4 percent threshold. The following section of this chapter outlines our risk of losing this Tier 1 status in the future.
While the sum of the $1.62 billion in BFM and the $64 million in tier funding is insufficient to fully fund CPS’ activity to the level the state recommends, CPS would require an additional $1.92 billion annually from the state to fully fund the investments that Chicago’s children deserve, equivalent to $5,348 per student. CPS supports any future efforts from the Governor and state legislative leaders to accelerate investments to fully fund the EBF model as quickly as possible.
The future of EBF
CPS faces two main risks to the fiscal stability that has been provided since the implementation of EBF in FY2018. The first is the distinct possibility that CPS slips to Tier 2 status within the next two to three years, which would mean that it loses approximately $30 million of new tier money. The second is that the amount of money diverted away from CPS towards charter schools approved by the SCSC grows, which increases the amount of funding that these schools receive compared to other non-SCSC charter schools.
- CPS faces becoming a Tier 2 district
In FY2020, CPS will be a Tier 1 district, which means we receive funds designated for districts whose local resources are least able to provide an adequate level of evidence-based investments in its children, as determined by the state. CPS is at 65.6 percent of adequacy, just 1.8 percentage points away from the Tier 1 threshold of 67.4 percent.
Each school district’s slice of the total state funding for EBF is calculated with the following equation. Each of the three components in this equation are likely to change in the near-term, which means it is more likely that CPS becomes a Tier 2 district.
Adequacy Target
The EBF formula heavily considers total enrollment and the proportion of low income students as determined by the Illinois Department of Human Services (DHS). When a district’s student population declines, or when the percentage of low income students decreases, EBF lowers the Adequacy Target accordingly.
From FY2019 to FY2020, the total student population in CPS as measured by the state decreased by 1.4 percent. Declining enrollment is a well-documented trend that is projected to continue in FY2020 and beyond. Additionally, the total count of low income students from DHS has decreased at a faster rate than the decline of the total student population. From 2014 to 2018, the low income population has declined by an average of 3.6 percent annually, with the largest single year decline of 6.31 percent coming in 2017 to 2018. The continuation of these two large macro trends will drive down the Adequacy Target for CPS.
Local Resources
As discussed in more detail in the Property Tax section of this chapter, Chicago saw relatively significant increases in property value in FY2019. If this trend continues in the next assessment year in FY2022, this will increase the amount of local resources. The amount of local resources that CPS can access is also boosted by higher PPRT revenues if corporate profits continue to grow. Both of these trends will drive up the Adequacy Percentage.
Statewide Ranking of Adequacy Percentage
The statewide threshold for a school district to be considered Tier 1 is a moving target, primarily dependent on the total amount of state-wide funding. If statewide funding increases from year to year, as is the case in FY2020, then there is more money available for Tier 1 funding, which is statutorily pegged at 50 percent of all new money. This moves up the Tier 1 percentage threshold, as do any changes to student population and local resources for all districts in Illinois.
Under ISBE calculations, all school districts that are below 67.4 percent of adequacy in FY2020 will be considered as Tier 1 schools who can receive the most funding. Even though CPS’ financial picture has improved, reflected in the 1.3 percentage point increase of its adequacy percentage from 64.3 percent in FY2019 to 65.6 percent in FY2020, it will remain a Tier 1 district in FY2020.
However, this is likely to change in future years absent broader state reform. Unless the state keeps increasing the total amount of tier funding available, therefore increasing the Tier 1 threshold, it is likely that CPS becomes a less-needy Tier 2 district within the next 2 to 5 years. Several ISBE formulas take an average of the past three years when considering a particular metric, which would delay CPS’ slide into Tier 2 status.
CPS being a Tier 2 district could jeopardize its current fiscal stability. It will receive $30.1 million in Tier 1 funding in FY2020, which it would not receive as a Tier 2 school district. This would constrain CPS’ ability to invest in schools. Because of PTELL, CPS has no ability to increase property tax revenues in order to fill the gap left by smaller increases in funding through EBF each year.
- More money is diverted to Illinois State Charter School Commission (SCSC)-approved schools
As it currently stands, schools that have their charter authorization rejected by the Chicago Board of Education can appeal directly to the Illinois State Charter School Commission (SCSC), a legal body governed by the Illinois Charter Schools Law that can overrule the local school board’s decision, allowing the school to stay open.
Unlike all other charter schools whose operating costs are paid for by CPS, the state pays for SCSC-approved schools by diverting EBF money away from CPS. In FY2020, five SCSC-approved schools are projected to receive $26 million in EBF diversion, which is a $4 million decline from FY2019. If the SCSC were to increase the total number of charter schools funded through them, or if their enrollment increased, CPS would lose out on more EBF money.
At publishing, there is state legislation pending in SB1226, which would abolish the SCSC on July 1, 2020, and transfer its powers to the Illinois State Board of Education. If signed into law by the Governor, SCSC-approved schools would continue operating absent any immediate change by ISBE. There is projected to be no fiscal impact from this legislation in FY2020.
Categorical Grants
CPS will receive approximately 20 categorical grants from the state in FY2020, totaling approximately $315.3 million. The majority of this revenue is earmarked for early childhood education, which will be worth $201.2 million. The remainder, totaling $114.1 million, will pay for Students with Disabilities' tuition costs, transportation, after-school programming, and nutrition, among other activities.
Under GSA, the grant money that CPS received was calculated by multiplying the total state appropriation for the programs included in the grant by the Board’s percentage share of those programs in FY1995. This grant structure no longer exists apart from early childhood, and CPS has to submit claims in order to receive most categorical grant revenues like all other school districts in Illinois.
CPS will receive a pre-defined 37 percent of total state appropriation of the early childhood block grant. In FY2020, the state appropriated an additional $50 million to the state-wide early childhood block grant in its budget, meaning CPS will receive an additional $18.5 million in budgeted revenue.
The district expects that all other grant revenues will slightly increase by $4.8 million from FY2019 budgeted levels. This is largely because of increased state appropriations to pay for district-level after -school programming and reimbursements of out-of-district tuition for Students with Disabilities.
State Contribution for Capital
The state revenue total of $32.4 million is comprised of $13.3 million in gaming revenue for new construction projects, $0.8 million from Illinois Green Infrastructure Grants, $0.3 million through state environmental fines, and $18 million in other potential state grants.
Federal Revenues
Most federal grants require the Chicago Board of Education to provide supplemental educational services for children from low-income households, children from non-English speaking families, and for neglected and delinquent children from preschool through 12th grade. These grants are dedicated to specific purposes and cannot supplant local programs. Medicaid reimbursement and Impact Aid are the only federal funding that is without any restriction.
Every Student Succeeds Act (ESSA) (previously known as No Child Left Behind)
- Title I-A — Low Income: Allocated based on a district’s poverty levels, this is the largest grant received under the ESSA. The grant allows the district to provide supplemental programs to improve the academic achievement of low-income students. CPS estimates that the district will receive $228.2 million in Title I funding in FY2020. This includes an anticipated reduction of $2.8 million in the formula-based Title I grant from FY2019 to FY2020. The anticipated total grant award for FY2020 is $254.6 million, which includes allowable carryover of $26.4 million from the previous year.
- Title I-A — IL Empower: This grant is a state-wide system of differentiated supports and accountability to improve student learning, purposely designed to develop capacity to meet student needs. CPS anticipates a grant award of $24.1 million in FY2020, which includes a carryover of $4.1 million from the previous year.
- Title I-A — School Improvement Grants 1003(g): School Improvement Grants help ensure that all students have grade-level reading and math skills. CPS estimates the total available amount will be $1 million in FY2020. A reduction of $3.4 million in funding from FY2019 is due to no new grants being awarded and grant expiration in FY2020.
- Title I-D — Neglected/Delinquent: This grant targets the educational services for neglected or delinquent children and youth in local and state institutions to assist them in attaining state academic achievement standards. Programs include academic tutoring, counseling, and other curricular activities. The anticipated total grant award for FY2020 is $2.4 million, which includes allowable carryover of $1 million from the previous year.
- Title II-A — Improving Teacher Quality: This grant funds class size reduction, recruitment and training, mentoring, and other support services to improve teacher quality. CPS anticipates a total of $22.7 million to be awarded for the FY2020 Title II-A grant, which includes a current award of $18.7 million and an estimated $4 million in carryover from the previous year.
- Title III-A — Language Acquisition: These funds support students with limited English proficiency who meet eligibility requirements. The total funding available is estimated at $7.6 million for FY2020, which does not include carryover from the previous year.
- Title IV-A — Student Support and Academic Enrichment Grants: These grants support states, local educational agencies, schools, and local communities to provide all students with access to a well-rounded education, improved student learning conditions in schools, and increased technology in order to improve the academic achievement and digital literacy of all students. CPS anticipates a total of $18.7 million to be awarded for the FY2020 Title IV-A grant, which includes a carryover of $4.8 million from the previous year.
- Title IV-B — 21st Century Community Learning Centers: These grants provide opportunities for communities to establish schools as community learning centers and provide activities during after-school and evening hours. CPS estimates grant awards of $9.4 million in FY2020, which includes an increase of $2.5 million from FY2019 through additional grants.
- Title VII-A — Indian Education: Funds from this grant are used to meet the educational and cultural needs of American Indian and Alaska Native students. Funds are expected to increase from $210,023 to $229,367 for FY2020.
Individuals with Disabilities Education Act (IDEA)
IDEA grants are allocated based on a state-established formula to provide supplemental funds for special education and related services to all children with disabilities from ages 3 through 21.
The IDEA grants include a number of programs:
- IDEA Part B Flow-Through: This is the largest IDEA grant, with the estimated award for FY2020 totalling $101 million, which includes $11 million in carryover funding from FY2019.
- IDEA Room and Board: This grant provides room and board reimbursement for students attending facilities outside of Chicago and is estimated at $2.5 million in FY2020.
- Part B Preschool: This grant offers both formula and competitive grants for special education programs for children ages 3–5 with disabilities. CPS is expected to stay level at $1.4 million from the formula grant and $489,250 from a competitive grant for FY2020.
Total FY2020 IDEA funding equals $105 million, including small competitive grants and carryover from the previous year in the preschool grant.
National School Lunch Program & Child and Adult Care Food Program
CPS offers free breakfast, lunch, after-school supper, after-school snacks, Saturday breakfast and lunch, and Head Start snacks for afternoon classes during the school year. The district also serves breakfast and lunch during summer school.
In 2012, CPS began participating in the Community Eligibility Provision program. All schools now are part of this program, which provides all students a free lunch regardless of income eligibility. CPS is reimbursed for all lunch meals at the maximum free reimbursement rate under the National School Lunch Program.
CPS’ school breakfast programs provide breakfast in the classroom free of charge to all students regardless of income.
In addition, the USDA reimburses CPS for free after-school supper through the Child and Adult Care Food Program. The nutrition department also takes advantage of the donated commodities program.
CPS anticipates $201.3 million in federal reimbursements for FY2020. These revenues include:
- $130 million for school lunches and snacks
- $49.5 million for breakfast programs
- $12.8 million of donated food from the U.S. Department of Agriculture
- $9 million for after-school meals
Medicaid Reimbursement
Local education agencies are required to provide special education and related services as delineated in the Individualized Education Program (IEP) or Individualized Family Service Plan (IFSP) at no cost to parents. Medicaid provides reimbursement for the:
- Delivery of covered direct medical services provided to eligible children who have disabilities in accordance with IDEA.
- Cost of specific administrative activities, including outreach activities designed to ensure that students have access to Medicaid-covered programs and services.
Medicaid provides reimbursement for covered direct medical services including: audiology, developmental assessments, medical equipment, medical services, medical supplies, nursing services, occupational therapy (OT), physical therapy (PT), psychological services, school health aide, social work, speech/language pathology, and transportation. When these services are provided under a child's IEP and that child is enrolled in Medicaid, the services are eligible for federal Medicaid reimbursement at the state’s reimbursement rate, approximately half of the established cost to provide the service.
Medicaid revenues in FY2020 are projected to remain stable at $35 million. FY2020 Medicaid revenues will be strengthened by continued revenue retention initiatives focused on improving time capture, maximizing claiming and billing processes, and ensuring all claimable costs are reimbursed. New initiatives include increasing compliance at non-public schools, improvements to paraprofessional documentation and approval, and reducing claim failures for OT and PT services due to expired prescriptions.
Other Federal Grants
This category includes competitive grants for other specific purposes, including:
- Carl D. Perkins: This grant was established to help students in secondary and post-secondary education develop academic and technical skills for career opportunities, specific job training, and occupational retraining. The FY2020 Perkins formula grant is anticipated to be $6.2 million, which includes an estimated rollover of $690,000.
- E-Rate: The Federal Communications Commission provides funding through its E-rate program to discount the cost of telecommunications, Internet access, and internal connections for schools and libraries across the country. In FY2020, CPS expects to receive $10 million of federal E-rate money to reimburse IT projects.
- Head Start: As the district continues to implement Universal Preschool (UPK), state and local funding will be used to replace Head Start funding beginning FY2020. This shift in funding is due to the district’s commitment to provide free, full-day preschool to all four-year-old students in Chicago. CPS will continue to provide comprehensive supports and services to all students regardless of funding source.
Federal Contribution for Capital
Federal contributions to the capital budget are expected to be $10.1 million; these contributions are driven by spending on E-Rate eligible upgrades to the district’s IT infrastructure.
Federal Interest Subsidy under Qualified School Construction Bonds (QSCBs) and Build America Bonds (BABs)
In FY2020, CPS has budgeted to receive a direct federal subsidy payment of $25 million for these two types of federally-subsidized bonds. This amount takes into consideration an allowance assumption of 7.5 percent for federal sequestration and has not changed from our FY2019 assumptions. See the Debt Management chapter for more information.
- The growth in a taxing district’s aggregate extension base (sum of all extensions for funds subject to the PTELL) is limited to 5 percent or the rate of inflation, whichever is less. The inflationary increase is equal to the percentage change in the Consumer Price Index (CPI) from the prior year, and is called the “limitation”. The CPI used is the national CPI for all urban consumers (CPI-U) for all items as published by the United States Department of Labor, Bureau of Labor Statistics. The December 2018 CPI-U, which impacts FY2020, was 1.9 percent.
- https://cps.edu/about/finance/official-statements-for-long-term-bonds/
- https://www.chicago.gov/city/en/depts/dcd/provdrs/tif/news/2018/november/proposals-would-terminate-five-tif-districts.html
- Specifically, CPS’ proportionate share of Transit TIF revenue is equal to its tax rate divided by the total composite tax rate faced by taxpayers. In 2018, CPS’ tax rate is 3.552 percent, 52.3 percent of the composite tax rate of 6.786 percent. Currently, this is the only TIF District which produces dedicated revenues for CPS, rather than being subject to the TIF Surplus mechanism common to all other Districts.
- https://www.cookcountyclerkil.gov/sites/default/files/publications/2018%2520TIF%2520Report.pdf, page 18
- https://www2.illinois.gov/rev/localgovernments/property/Documents/cpihistory.pdf
- https://www2.illinois.gov/sites/budget/Documents/Budget%20Book/FY2020-Budget-Book/Fiscal-Year-2020-Operating-Budget-Book.pdf, page 139
- https://www2.illinois.gov/rev/localgovernments/replacementtaxestimate/Pages/replacement20.aspx
- https://www.cityofchicago.org/content/dam/city/depts/obm/supp_info/2019Budget/2018AnnualFinancialAnalysis_CityofChicago.pdf, page 109