The Annual Regional Analysis is a set of facts to inform community dialogue and district planning to address a central guiding question - What do families and communities need in terms of school options?
The purpose of the ARA is to support CPS’s goal of providing every student with high-quality education in every neighborhood by giving stakeholders a consistent array of information regarding school quality, enrollment patterns, school choice, and program offerings by region. The goal is to ensure that every student in Chicago has access to quality public schools and a variety of schools and programs.
The report includes information on all CPS schools, including traditional neighborhood, Selective Enrollment, Magnet, Charter, Special Education Specialty, and Options (alternative) high schools.
This document is a common fact base from which to understand the school landscape in communities. The intent of the ARA is not to provide recommendations but instead a set of findings based on district and regional data that serves as an input to inform community dialogue and district planning.
Structure & Organization
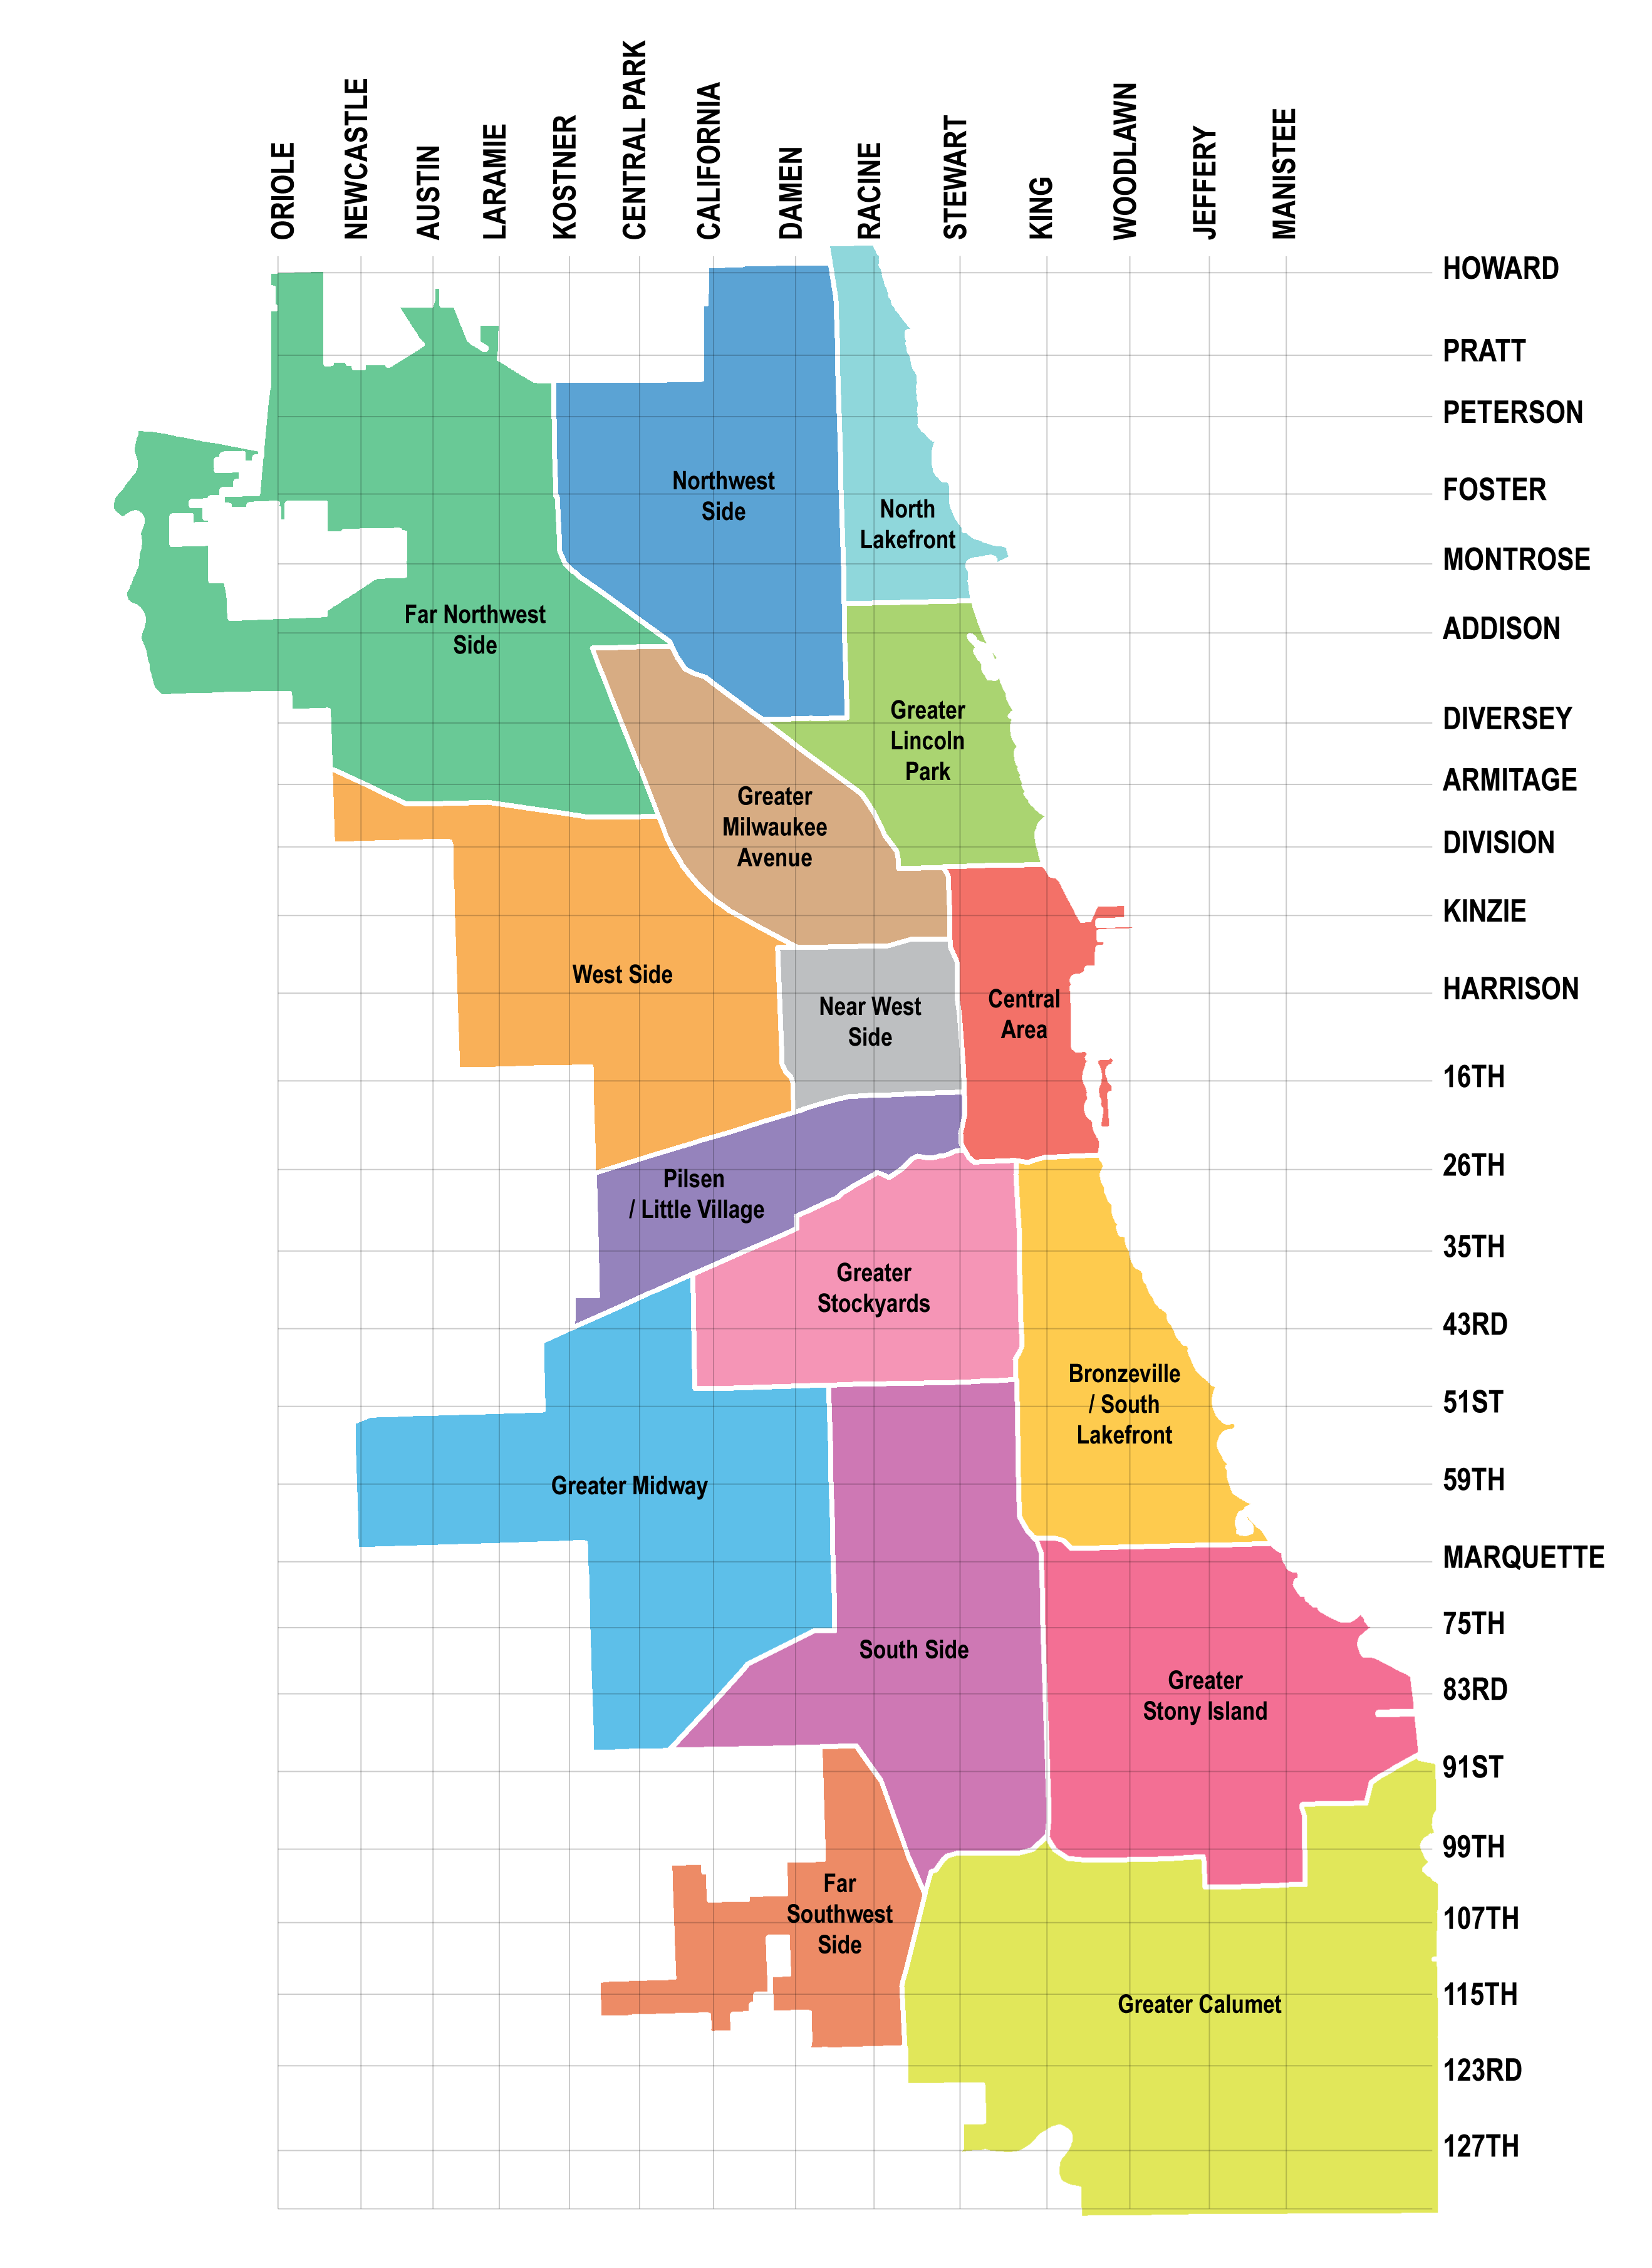
The ARA is organized by the 16 geographic regions designated within the Chicago Neighborhoods Now planning initiative. The regions were created by the City of Chicago's Department of Planning and Development based on research on housing and jobs. They are defined with natural boundaries, such as rivers and rail lines, in mind. These elements, as well as transportation options, are likely considerations for families in choosing schools. With the goal of utilizing a consistent structure year to year, these regions are more stable than city wards and school networks.
-
MAP OF CPS SCHOOLS
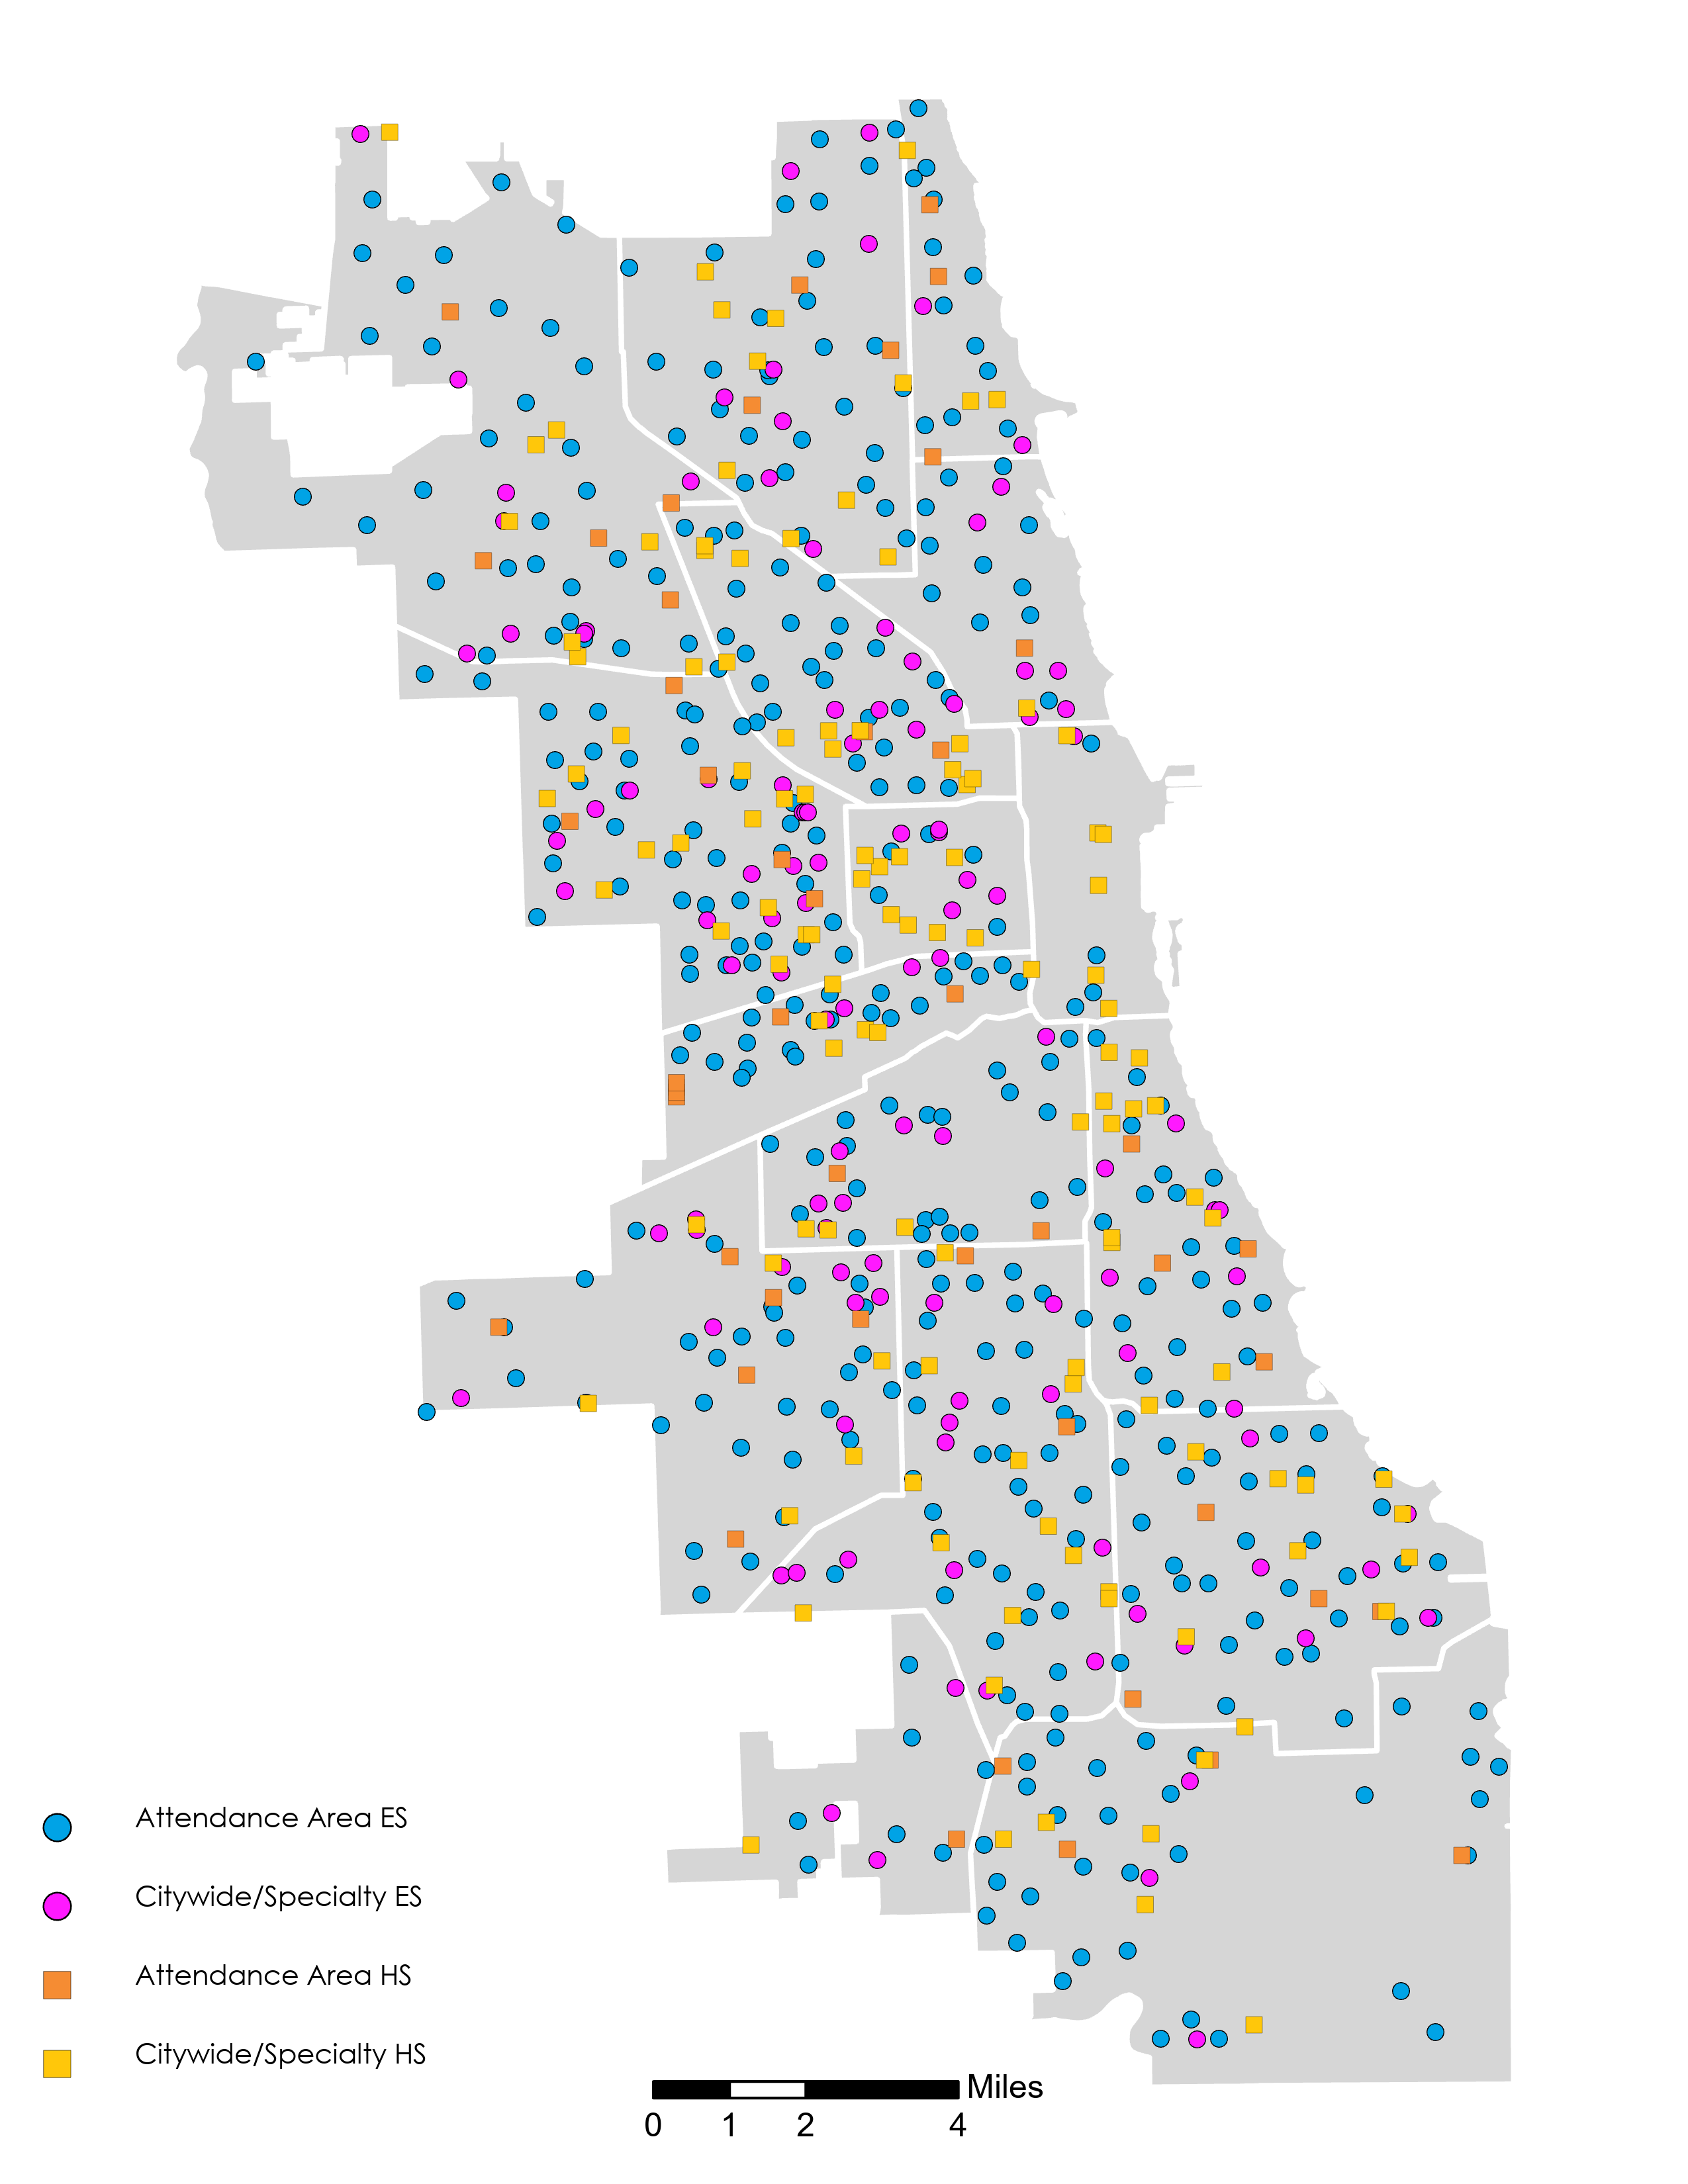
Attendance Area and Citywide Schools
Some schools have attendance boundaries and others are citywide. Schools with attendance area boundaries are also referred to as zoned schools. Every street address in the City of Chicago is assigned one attendance area elementary school and one high school. To identify specific school boundaries, use the CPS School Locator, schoolinfo.cps.edu/schoollocator/index.html. Students can attend their designated zoned school without having to submit an application. Students can apply to attend another zoned school that has available seats and admission is determined by a lottery. Citywide schools do not have attendance boundaries and admit students through a lottery.
School-level admissions criteria referenced in this report are for students applying in the Fall of 2021. For more information about the school application process and admissions criteria, visit go.cps.edu. For descriptions of the program types, visit cps.edu/Pages/AcademicProgramRFP.aspx.
-
The racial/ethnic and socioeconomic composition of CPS has remained relatively the same since the 2018-19 school year.
Racial/Ethnic Composition
Over the past four years, the proportion of students from all racial/ethnic backgrounds has remained relatively the same. However, the population of students identifying as Latinx has decreased by 14,957 students, the population of students identifying as Black has decreased by 13,169 students, and the population of students identifying as White has decreased by 2,367.
| District-wide, student enrollment has declined by more than 30,000 students since the 2018-19 school year.
RACIAL/ETHNIC COMPOSITION OVER TIME
Race/Ethnicity
AsianBlackLatinxOtherWhite
Free and Reduced Lunch Rates
Over the last 4 years, the percentage of students who qualify for free and reduced lunch (FRL) has remained relatively the same since 2018-19 with 78% of students currently qualifying.1
FREE AND REDUCED LUNCH RATE OVER TIME
Free and Reduced LunchWithout Free and Reduced LunchMedian Household Income
less than $39,000$39,000 to $50,299$50,300 to $64,499$64,500 to $86,199$86,200 or more
1 Before 2015, CPS relied on the Nutrition Services department to administer, communicate, and collect the FRL forms. When the federal lunch program was expanded to all students, CPS needed to administer a separate “Fee Waiver Form” that replaced the FRL form. As fee waivers continue to be collected throughout the school year, the percentage of qualifying students increases. In ARAs prior to SY21, the FRL data presented was from the 20th day of school. In this year's ARA, the data was collected in March 2022 to reflect the most up-to-date information.
-
Historical Enrollment
District enrollment numbers include all students in grades Pre-K through 12th grade on the 20th day of each school year. The projections and forecast estimates are created by the CPS Department of Planning and Data Management and are based on historical enrollment trends at each school. Nationally, other school districts are experiencing similar enrollment declines; impacted in part by the COVID-19 global pandemic.
| Since 2012-13, CPS total enrollment has decreased 18%1
| Over the next 3 years, the projections estimate potential decreases ranging from 3% to 5%2
HISTORICAL DISTRICT ENROLLMENT AND PROJECTION
Factors Impacting Enrollment
Broader citywide population trends indicate continued declining enrollment.1) DECLINING BIRTHRATE
There has been a declining number of births per year in Chicago, leading to a consistent decline in the childhood population in the city. The number of births affects CPS enrollment approximately five years later, when children are expected to enter kindergarten.3
HISTORICAL CHICAGO BIRTHRATE
2) DECLINING CHILDHOOD POPULATION
The population of children ages 3 to 18 in Chicago is declining. This pattern is consistent for children enrolled in public or private/parochial schools. The “not enrolled” category includes 3- and 4-year-olds who are not in pre-school to 18-year-olds who have graduated from high school but are not enrolled in college, and children who are truant or have dropped out. This chart combines CPS enrollment data and U.S. Census Bureau data for the 2011-12 to 2020-21 school years.4
HISTORICAL CHICAGO CHILDHOOD POPULATION
Not EnrolledPublicPrivate1Enrollment across CPS continues to decline; impacted in part by the COVID-19 global pandemic.
2The range is calculated using 2019-20, 2020-21, and 2021-22 20th day enrollment data. These years represent one pre-pandemic year and two years of enrollment impacted in part by the COVID-19 global pandemic. Projections are preliminary and will be updated once data becomes available on the 20th day of the upcoming school year.
3Data source: Illinois Department of Public Health. Birthrate data from 2019 is the most recent year available.
41-year American Community Survey census data, https://www.census.gov/programs-surveys/acs/microdata.html
-
Since 2013, CPS has used the School Quality Rating Policy (SQRP) to evaluate and publicly report on annual school performance. In 2020, CPS suspended the SQRP due to the impact of COVID-19. School quality ratings were not released for school year 2020-21 and again for 2021-22.
The Annual Regional Analysis has utilized school quality ratings to explore and present data on student and school performance across the district since the ARA was first released in 2017. The absence of updated ratings limits our ability to present comprehensive and comparable indicators of school quality. This year, CPS has opted not to present the portions of the Quality section that rely exclusively on SQRP data. Postsecondary indicators of student success have been included as they rely on data that has consistently and reliably been available over the last two years. This data, while an incomplete picture of student performance and school quality, presents a perspective on how CPS schools are preparing students for graduation and life after high school.
Lastly, CPS is currently engaging in an accountability redesign process to develop the district’s new School Quality Rating Policy. The goals of the redesigned SQRP are to:
- Provide a more complete picture of school performance and progress
- Improve the district's capacity to support schools
- Provide clear information to parents and the public
- Evaluate and report on district effectivenessWhen implemented, updated SQRP data will be made available in the ARA Quality section. For more information on the SQRP accountability redesign initiative, visit cps.edu/strategic-initiatives/accountability-redesign/.
How Has School Quality Led to Student Preparedness for Postsecondary Success?
-
While the School Quality Rating Policy (SQRP) was suspended for school years 2020-21 and 2021-22, some data on student outcomes is available as an indicator of how schools are preparing high school students for postsecondary success.
-
In the 2020-21 school year, 80% of high school students graduated high school in four years. Since 2017-18, the high school graduation rate has increased from 78%.
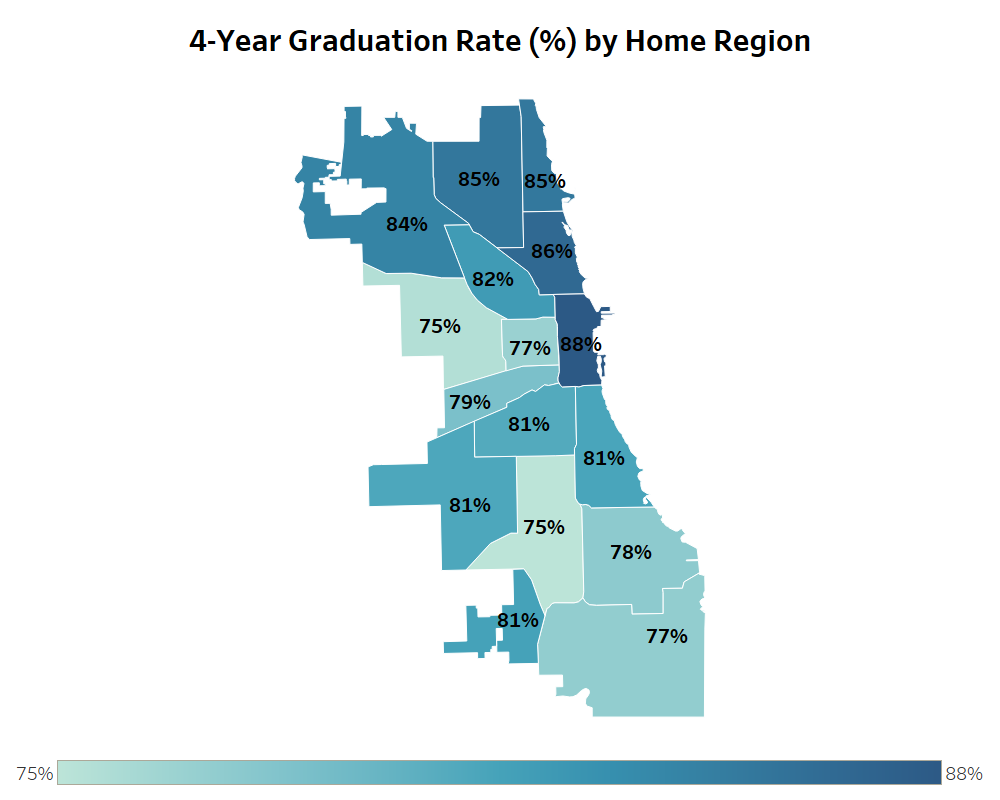
4-Year Graduation Rate (%) by Home Region
NOTE: For more information about how the high school graduation rate is calculated, visit cps.edu/about/district-data/metrics/.
-
For high school students who graduated in 2020, 62% enrolled in college after graduation. Since the class of 2017, the college enrollment rate has decreased from 68%.
Nationally, college enrollment and persistence has declined significantly in the last two years; impacted greatly by the COVID-19 global pandemic.
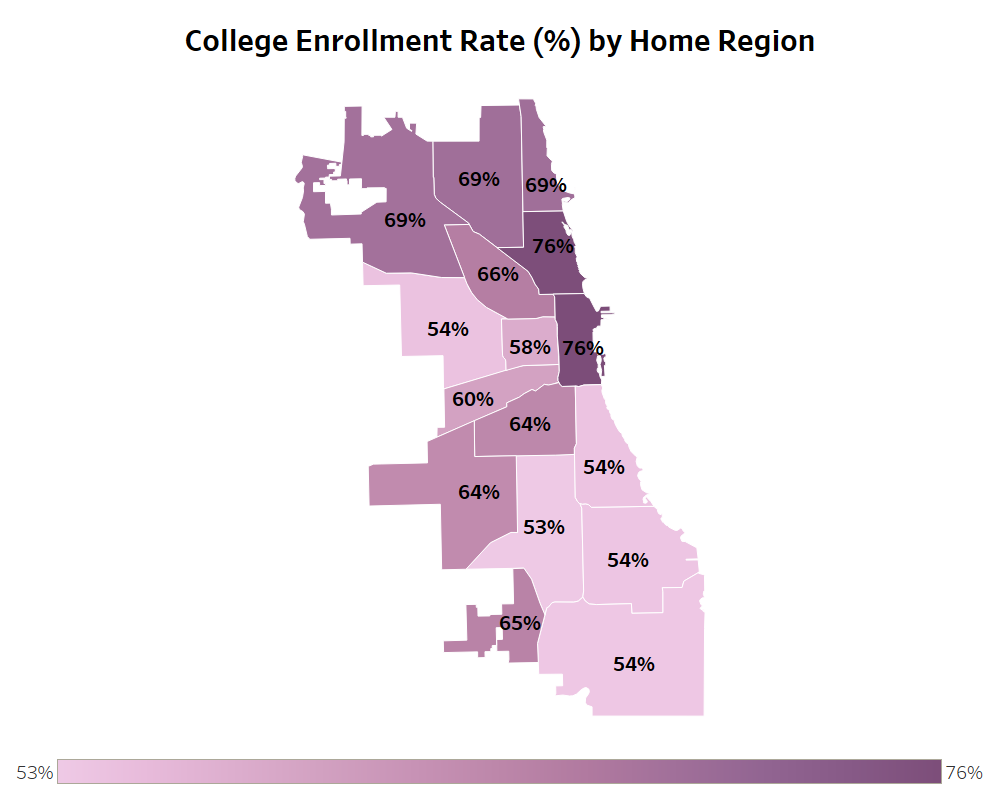
College Enrollment Rate (%) by Region
NOTE: The graduating class of 2020 is the most recent year that college enrollment data is available. For more information about how the college enrollment rate is calculated, visit cps.edu/about/district-data/metrics/.
-
For high school students who graduated in 2019, 72% enrolled and persisted in college. Since the class of 2016, the college persistence rate has remained relatively stable at 72%.
Nationally, college enrollment and persistence has declined significantly in the last two years; impacted greatly by the COVID-19 global pandemic.
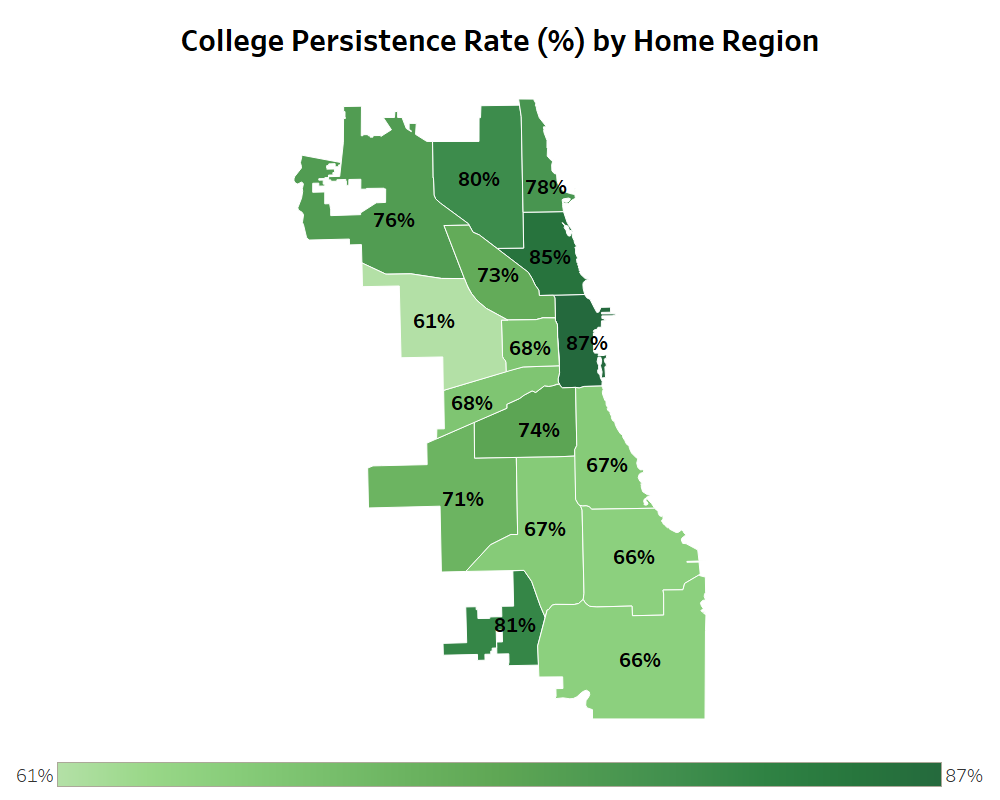
College Persistence Rate (%) by Region
NOTE: The graduating class of 2019 is the most recent year that college persistence data is available. For more information about how the college persistence rate is calculated, visit cps.edu/about/district-data/metrics/.
How Many Students Are There?
-
The population of the district has decreased by 30,903 students since the 2018-19 school year, a decline of 8.6%. This change has been driven primarily by a decline of students in grades K-8 (a decrease of 27,501 students over four years or 11.6%), while the number of high school students has been more consistent (decreasing by 1,164 students over four years or 1.1%).
CPS STUDENT POPULATION OVER TIME
9 - 12K - 8PE & PKNOTE: Enrollment data is from the annual 20th-day count (September 27th, 2021).
Enrollment across CPS continues to decline; impacted in part by the COVID-19 global pandemic.
How Many Seats Are There for the Student Population?
-
There is currently space to serve over 450,000 students across grades K-12 with more than 140,000 unfilled seats this school year. The difference between the number of enrolled students and seats available is expected to grow in the coming years.
Number of Students Enrolled in Elementary and High School Buildings1

Seats

Students
SCHOOL YEAR 2021-22
SCHOOL YEAR 2024-2025 PROJECTION
Elementary School SeatsHigh School Seats1. Enrollment and seats figures listed here do not include Pre-K and Cluster students
2. Number of seats is the adjusted ideal capacity of the school building or the charter contract enrollment cap.
3. Elementary grade students enrolled in combination K-12 schools are grouped into the high school category.
4. Enrollment across CPS continues to decline; impacted in part by the COVID-19 global pandemic.
How Many Pre-Kindergarten Seats Are There for the Student Population?
-
Total Pre-K Seats
In the 2021-22 school year, there were 22,890 Pre-K seats in school-based Pre-K programs, including full- and half-day seats.
The Far Northwest Side and the Greater Midway regions have the greatest number of seats, with 3,067 and 2,460 seats respectively. The Far Northwest Side and the West Side regions have the greatest number of full-day Pre-K seats, with 1,930 and 1,890 respectively.
TOTAL PRE-K SEATS BY REGION
Full DayHalf Day*Percentage of CPS kindergarten and Pre-K students provided to show how regions differ in size of population.
-
In the 2021-22 school year, total Pre-K enrollment as of the 20th day of school (September 27th, 2021) was 15,430 students in school-based Pre-K programs. 71% of Pre-K students are enrolled in full-day programs. Pre-K students continue to enroll over the course of the school year.
TOTAL PRE-K ENROLLMENT BY REGION
Full Day Age 4Half Day Age 4Full Day Age 3Half Day Age 3 -
Full-Day Pre-K Enrollment vs. Seats
District-wide, 67% of full-day Pre-K seats were filled as of the 20th day of school (September 27th, 2021). The majority of unfilled full-day seats are in the West Side (891), South Side (580), Far Northwest Side (486), and Pilsen / Little Village (483) regions. Pre-K students continue to enroll over the course of the school year.
FULL-DAY PRE-K ENROLLMENT VS. SEATS BY REGION
Filled Pre-K SeatsUnfilled Seats -
Pre-K Enrollment by Race/Ethnicity
District-wide, enrollment in Pre-K by race and ethnicity mostly mirrors enrollment by race and ethnicity in Kindergarten. 45% of Pre-K students identify as Latinx, compared with 43% of Kindergarten students, and 35% of both Pre-K and Kindergarten students identify as Black. Pre-K students continue to enroll over the course of the school year.
PRE-K AND KINDERGARTEN ENROLLMENT BY RACE/ETHNICITY
Race/Ethnicity
AsianBlackLatinxOtherWhite
Are Elementary School Students Choosing Schools in Their Region?
-
Elementary School Student Choice Over Time
School choice is currently defined as choosing to attend a school that is not a student’s zoned (or assigned) school. Over the past four years, elementary school students attending a non-zoned school (in or out of region) has increased from 42% to 44% across the district. In the same time frame, students attending their zoned school has decreased from 59% to 56%.
Elementary school students attending a school in their home region (zoned or non-zoned) has remained relatively the same at around 82%, while students attending school out of region has also remained at 18%.
ELEMENTARY SCHOOL STUDENT CHOICE OVER TIME
Attending School Out of RegionAttending Non-Zoned in RegionAttending Zoned SchoolNOTE: Only K-8 grade students are included in school choice calculations as Pre-K students are not zoned to a school. Due to rounding, some charts may not add up to 100%
Elementary School Choice by Race/Ethnicity
School choice varies by race/ethnicity. District-wide, 44% of elementary school students identifying as Black attend their zoned school compared to 62% of elementary school students identifying as Latinx, 69% of elementary school students identifying as White, and 63% of elementary school students identifying as Asian. Students identifying as Black are also the greatest percentage attending school out of their home region (23%), except for students identifying as other ethnicities (24%). Students identifying as White or Latinx have the lowest percentage attending school out of their home region at 14% and 16% respectively.
ELEMENTARY SCHOOL STUDENT CHOICE BY RACE/ETHNICITY
NOTE: Due to rounding, some charts may not add up to 100%.
Attending School Out of RegionAttending Non-Zoned in RegionAttending Zoned SchoolElementary School Student Choice by Region
The Pilsen / Little Village region has the greatest percentage of students who attend school in their region (zoned or non-zoned school) at 89% and the Near West Side region has the lowest percentage at 67%.
| District-wide, 18% of elementary school students attend school out of the region where they live.
ELEMENTARY SCHOOL STUDENT CHOICE BY REGION
Attending Zoned SchoolAttending Non-Zoned in RegionAttending School Out of RegionNOTE: Due to rounding, some charts may not add up to 100%.
Elementary School Student's Distance Traveled to School
These graphs show the average distance traveled for elementary school students who live in each region, regardless of whether they attend school in or out of the region.
District-wide, elementary students travel an average of 1.5 miles to school. 66% of students travel less than 1 mile to school and 15% of students travel 3 miles or more to school.
ELEMENTARY SCHOOL STUDENT’S AVERAGE DISTANCE TRAVELED TO SCHOOL BY REGION
There is significant variation in distance traveled to school by region. 84% of students residing in Pilsen / Little Village travel less than 1 mile to school compared to 50% of students in the West Side region.
ELEMENTARY SCHOOL STUDENT’S AVERAGE DISTANCE TRAVELED TO SCHOOL BY REGION
Less than 1 mile1 - 2.9 miles3 - 5.9 miles6 miles or moreNOTE: Distance traveled and commute time are calculated based on the student’s home address and the address of their school. Commute time was calculated using Google Maps travel time estimations using the shorter travel time between walking and public transit. The analysis takes into account school start times and chooses routes that minimize travel and wait time. Any wait time before a trip starts is not included but wait times due to transfers are included.
Due to rounding, some charts may not add up to 100%.
Elementary Student's Time Traveled to School
These graphs show the average commute time for elementary school students who live in each region, regardless of whether they attend school in or out of the region.
District-wide, elementary students travel an average of 16 minutes to school. 68% of students travel less than 15 minutes to school and 7% of students travel 45 minutes or more to school.
ELEMENTARY SCHOOL STUDENT’S AVERAGE TIME TRAVELED TO SCHOOL BY REGION
There is significant variation in time traveled to school by region. 85% of students residing in Pilsen / Little Village travel less than 15 minutes to school compared to 57% of students in Greater Stony Island and West Side.
ELEMENTARY SCHOOL STUDENT’S AVERAGE TIME TRAVELED TO SCHOOL BY REGION
Less than 15 minutes15 - 29 minutes30 - 44 minutes45 - 59 minutes60 minutes or moreNOTE: Distance traveled and commute time are calculated based on the student’s home address and the address of their school. Commute time was calculated using Google Maps travel time estimations using the shorter travel time between walking and public transit. The analysis takes into account school start times and chooses routes that minimize travel and wait time. Any wait time before a trip starts is not included but wait times due to transfers are included.
Due to rounding, some charts may not add up to 100%.
Elementary School Student's Distance Traveled to School by Race/Ethnicity
There is some variation in travel distances by race and ethnicity. District-wide, 72% of elementary school students identifying as Latinx and 71% of elementary school students identifying as White travel less than 1 mile to go to school, compared to 56% of students identifying as Black and 58% of students identifying as other ethnicities. 8% of students identifying as Black travel 6 miles or more, compared to 3% of students identifying as Latinx and 2% of students identifying as White.
ELEMENTARY SCHOOL STUDENT'S DISTANCE TRAVELED TO SCHOOL BY RACE/ETHNICITY
Less than 1 mile1 - 2.9 miles3 - 5.9 miles6 miles or moreNOTE: Due to rounding, some charts may not add up to 100%.
Elementary School Student's Time Traveled to School by Race/Ethnicity
There is also some variation in travel times by race and ethnicity. District-wide, 73% of elementary school students identifying as Latinx and 71% of elementary school students identifying as White travel less than 15 minutes to school, compared to 60% of students identifying as Black or students identifying as other races/ethnicities. 10% of students identifying as Black travel more than 45 minutes, compared to 5% of students identifying as Latinx or White.
ELEMENTARY SCHOOL STUDENT'S TIME TRAVELED TO SCHOOL BY RACE/ETHNICITY
Less than 15 minutes15 - 29 minutes30 - 44 minutes45 - 59 minutes60 minutes or moreNOTE: Due to rounding, some charts may not add up to 100%.
Are High School Students Choosing Schools in Their Region?
-
Percentage of 8th Grade Students Who Applied to High School
Since 2017-18, CPS has utilized the GoCPS platform to allow students to research and apply to all high schools and high school programs. Students are asked to rank in order of preference the schools and programs they are most interested in. Students are still guaranteed a seat in the general education program at their zoned high school and do not have to submit a GoCPS application for that program. For more information about the GoCPS and the high school application process, visit go.cps.edu.
District-wide, 93% of all 8th grade CPS students applied to high school programs across Rounds 1 and 2 of the GoCPS application process. Pilsen / Little Village, West Side, and Greater Stockyards regions had the greatest application rate (97%) while the Far Northwest Side had the least (87%).
PERCENTAGE OF 8TH GRADE STUDENTS WHO APPLIED TO HIGH SCHOOL
AppliedDid Not ApplyNOTE: Due to rounding, some charts may not add up to 100%.
Percentage of 8th Grade Students Who Received an Offer from One of Their Top 3 Choices
Of all 8th grade CPS students that applied to high school programs in Round 1, 91% received an offer from one of their top three choices. The greatest percentage of students that receive an offer from one of their top three choices reside in the Greater Calumet region at 99% compared to 87% of students in the Greater Stockyards region. This figure does not include selective enrollment high schools as those schools use a different ranking process in GoCPS.
PERCENTAGE OF 8TH GRADE STUDENTS WHO RECEIVED AN OFFER FROM ONE OF THEIR TOP 3 CHOICES
1st Choice2nd Choice3rd Choice4th or lower ChoiceNOTE: This analysis only includes 8th grade applicants who were enrolled on the 20th day of school in 2021-22. Due to rounding, some charts may not add up to 100%.
High School Student Choice Over Time
School choice is currently defined as choosing to attend a school that is not a student’s zoned (or assigned) school. Over the past four years, high school students attending a non-zoned school (in or out of region) has remained relatively the same at 77%, while students attending their zoned school has also remained relatively the same at 24%.
High school students attending a school in their home region (zoned or non-zoned) has remained relatively the same at 56%, while students attending school out of region has also remained at 45%.
HIGH SCHOOL STUDENT CHOICE OVER TIME
NOTE: Due to rounding, some charts may not add up to 100%.
Attending School Out of RegionAttending Non-Zoned in RegionAttending Zoned SchoolHigh School Student Choice by Race/Ethnicity
School choice does vary by race/ethnicity. This year, 15% of high school students identifying as Black attended their zoned school, compared to 30% of high school students identifying as White, 29% of high school students identifying as Latinx, and 24% of high school students identifying as Asian. Students identifying as Black are also the greatest percentage attending a school out of their home region (51%). Students identifying as Latinx have the lowest percentage attending a school out of their home region (40%).
HIGH SCHOOL STUDENT CHOICE BY RACE/ETHNICITY
NOTE: Due to rounding, some charts may not add up to 100%.
Attending School Out of RegionAttending Non-Zoned in RegionAttending Zoned SchoolHigh School Student Choice by Region
District-wide, more than twice as many high school students (45%) attend school out of their home region compared to elementary students (18%). The Northwest Side region has the greatest percentage of students who attend school in their region (zoned or non-zoned school) at 75% and the Greater Stony Island region has the lowest percentage at 35%.
| District-wide, 45% of high school students attend school out of the region where they live.
HIGH SCHOOL STUDENT CHOICE BY REGION
Attending Zoned SchoolAttending Non-Zoned in RegionAttending School Out of RegionNOTE: Due to rounding, some charts may not add up to 100%.
High School Student's Distance Traveled to School
These graphs show the average distance traveled for high school students who live in each region, regardless of whether they attend school in or out of the region.
High school students travel an average of 3.3 miles to school. 19% of students travel less than 1 mile to school and 42% of students travel 3 miles or more to school.
HIGH SCHOOL STUDENT’S DISTANCE TRAVELED TO SCHOOL BY REGION
There is significant variation in distance traveled to school by region. 27% of students residing in the North Lakefront region travel less than 1 mile compared to 9% of students in the Greater Stony Island region.
HIGH SCHOOL STUDENT’S DISTANCE TRAVELED TO SCHOOL BY REGION
Less than 1 mile1 - 2.9 miles3 - 5.9 miles6 miles or moreNOTE: Distance traveled and commute time are calculated based on the student’s home address and the address of their school. Commute time was calculated using Google Maps travel time estimations using the shorter travel time between walking and public transit. The analysis takes into account school start times and chooses routes that minimize travel and wait time. Any wait time before a trip starts is not included but wait times due to transfers are included.
Due to rounding, some charts may not add up to 100%.
High School Student's Time Traveled to School
These graphs show the average commute time for high school students who live in each region, regardless of whether they attend school in or out of the region.
High school students travel an average of 30 minutes to school. 25% of students travel less than 15 minutes to school and 18% of students travel 45 minutes or more to school.
HIGH SCHOOL STUDENT’S TIME TRAVELED TO SCHOOL BY REGION
There is significant variation in time traveled to school by region. 34% of students residing in the Near West Side region travel less than 15 minutes compared to 14% of students in the South Side region.
HIGH SCHOOL STUDENT’S TIME TRAVELED TO SCHOOL BY REGION
Less than 15 minutes15 - 29 minutes30 - 44 minutes45 - 59 minutes60 minutes or moreNOTE: Distance traveled and commute time are calculated based on the student’s home address and the address of their school. Commute time was calculated using Google Maps travel time estimations using the shorter travel time between walking and public transit. The analysis takes into account school start times and chooses routes that minimize travel and wait time. Any wait time before a trip starts is not included but wait times due to transfers are included.
Due to rounding, some charts may not add up to 100%.
High School Student's Distance Traveled to School by Race/Ethnicity
There is some variation in travel distances by race and ethnicity. 23% of high school students identifying as Latinx travel less than 1 mile to school, compared to 14% of high school students identifying as Black. 20% of students identifying as Black travel 6 miles or more, compared to 12% of students identifying as Latinx and 13% of students identifying as Asian.
HIGH SCHOOL STUDENT’S DISTANCE TRAVELED TO SCHOOL BY RACE/ETHNICITY
Less than 1 mile1 - 2.9 miles3 - 5.9 miles6 miles or moreNOTE: Due to rounding, some charts may not add up to 100%.
High School Student's Time Traveled to School by Race/Ethnicity
There is also some variation in travel times by race and ethnicity. 30% of high school students identifying as Latinx travel less than 15 minutes to school, compared to 20% of high school students identifying as Black, 21% of high school students identifying as White, and 22% of high school students identifying as Asian. 24% of students identifying as Black travel 45 minutes or more, compared to 16% of students identifying as Latinx, White, or Asian.
HIGH SCHOOL STUDENT’S TIME TRAVELED TO SCHOOL BY RACE/ETHNICITY
Less than 15 minutes15 - 29 minutes30 - 44 minutes45 - 59 minutes60 minutes or moreNOTE: Due to rounding, some charts may not add up to 100%.
Are Options High School Students Choosing Schools in Their Region?
-
Options High School Student Choice Over Time
Options high schools serve students who need a new pathway toward high school graduation. CPS schools offer additional supports and services for students who have been out of school and seek to return or who may need opportunities to earn credits in an accelerated program. Some of CPS’ campuses offer additional supports such as counseling and alternative schedules for students who may work during the traditional school day.
Options high schools exist in every region except the Greater Lincoln Park and Far Southwest Side regions. Options high schools do not have attendance zones or admission criteria although many serve only students 16 years and older. Students can choose to attend any Options high school within or outside of their home region. For this reason, Choice patterns tend to differ for Options students compared to elementary and other high school students.
Over the past four years, the percentage of Options high school students attending a school in their region has remained relatively the same at 39%. District-wide, Options high school students attend school out of region at a greater rate than elementary and high school students.
OPTIONS HIGH SCHOOL STUDENT CHOICE OVER TIME
NOTE: Due to rounding, some charts may not add up to 100%.
Attending School Out of RegionAttending Non-Zoned in RegionOptions High School Student Choice by Region
District-wide, a greater percentage of Options high school students attend school out of region than both high school and elementary students. The Far Southwest Side and Greater Lincoln Park regions both have the greatest percentage of students attending school out of region at 100%. This is because there are no Options high schools in those regions. For regions where an in-region Options high school exists, the Pilsen / Little Village and Greater Milwaukee Avenue regions have the greatest percentage of students attending an in-region Options high school.
OPTIONS HIGH SCHOOL STUDENT CHOICE BY REGION
Attending Non-Zoned in RegionAttending School Out of RegionNOTE: Due to rounding, some charts may not add up to 100%.
Options High School Students' Distance Traveled to School
This graph shows the average distance traveled for Options high school students who live in each region, regardless of whether they attend school in or out of the region.
The average Options high school student in the district travels 4.0 miles to school. The regions with the shortest average commute are Greater Milwaukee Avenue (2.5 miles) and Pilsen / Little Village (2.6 miles). The regions with the longest average commute are the Greater Calumet (5.3 miles) and North Lakefront (5.1 miles) regions.
District-wide, 13% of Options high students travel less than 1 mile to school and 51% of students travel 3 miles or more to school.
OPTIONS HIGH SCHOOL STUDENT’S DISTANCE TRAVELED TO SCHOOL BY REGION
OPTIONS HIGH SCHOOL STUDENT’S DISTANCE TRAVELED TO SCHOOL BY REGION
Less than 1 mile1 - 2.9 miles3 - 5.9 miles6 miles or moreNOTE: Distance traveled and commute time are calculated based on the student’s home address and the address of their school. Commute time was calculated using Google Maps travel time estimations using the shorter travel time between walking and public transit. The analysis takes into account school start times and chooses routes that minimize travel and wait time. Any wait time before a trip starts is not included but wait times due to transfers are included.
Due to rounding, some charts may not add up to 100%.
Options High School Students' Time Traveled to School
This graph shows the average time traveled for Options high school students who live in each region, regardless of whether they attend school in or out of the region.
The average Options high school student in the district travels 33 minutes to school. The regions with the shortest average commute are Greater Milwaukee Avenue (23 minutes) and Pilsen / Little Village (23 minutes). The regions with the longest average commute are the Northwest Side (41 minutes) and Grater Calumet (41 minutes).
District-wide, 18% of Options high school students travel less than 15 minutes to school and 22% of students travel 45 minutes or more to school.
OPTIONS HIGH SCHOOL STUDENT’S TIME TRAVELED TO SCHOOL BY REGION
OPTIONS HIGH SCHOOL STUDENT’S TIME TRAVELED TO SCHOOL BY REGION
Less than 15 minutes15 - 29 minutes30 - 44 minutes45 - 59 minutes60 minutes or moreNOTE: Distance traveled and commute time are calculated based on the student’s home address and the address of their school. Commute time was calculated using Google Maps travel time estimations using the shorter travel time between walking and public transit. The analysis takes into account school start times and chooses routes that minimize travel and wait time. Any wait time before a trip starts is not included but wait times due to transfers are included.
Due to rounding, some charts may not add up to 100%.
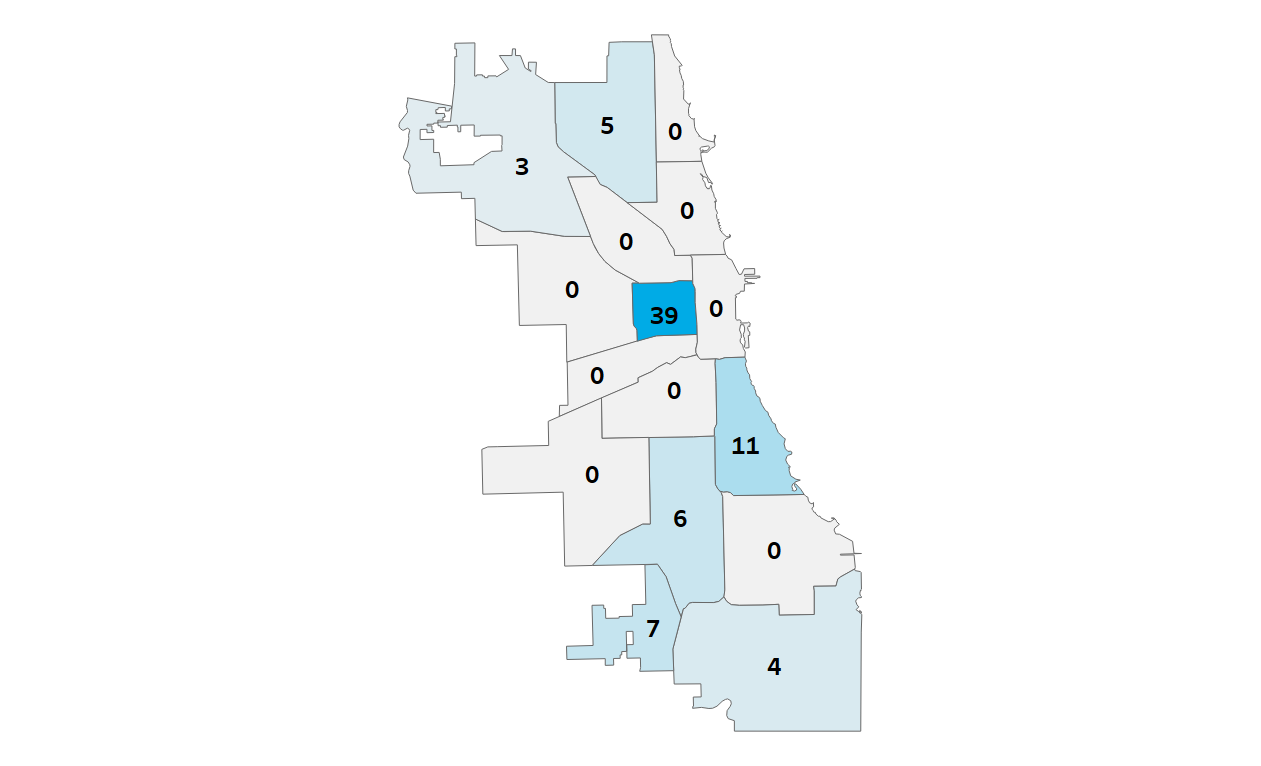
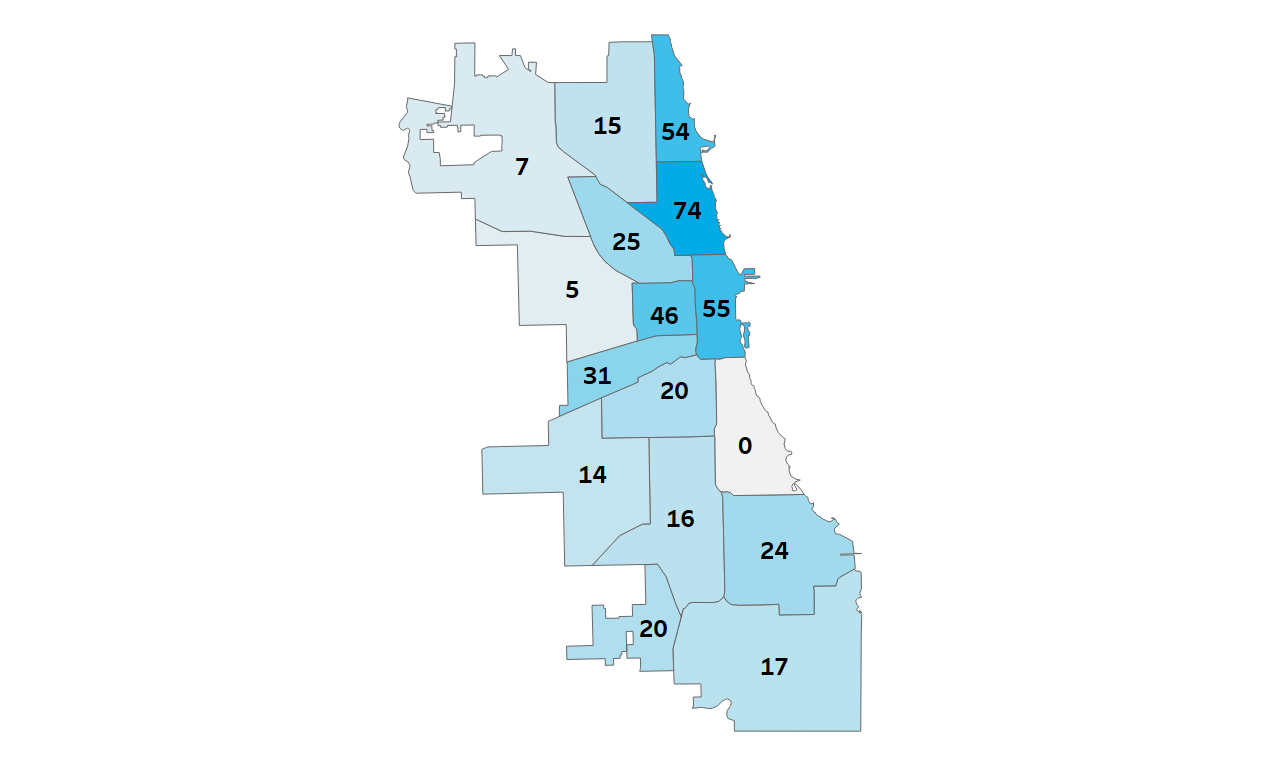
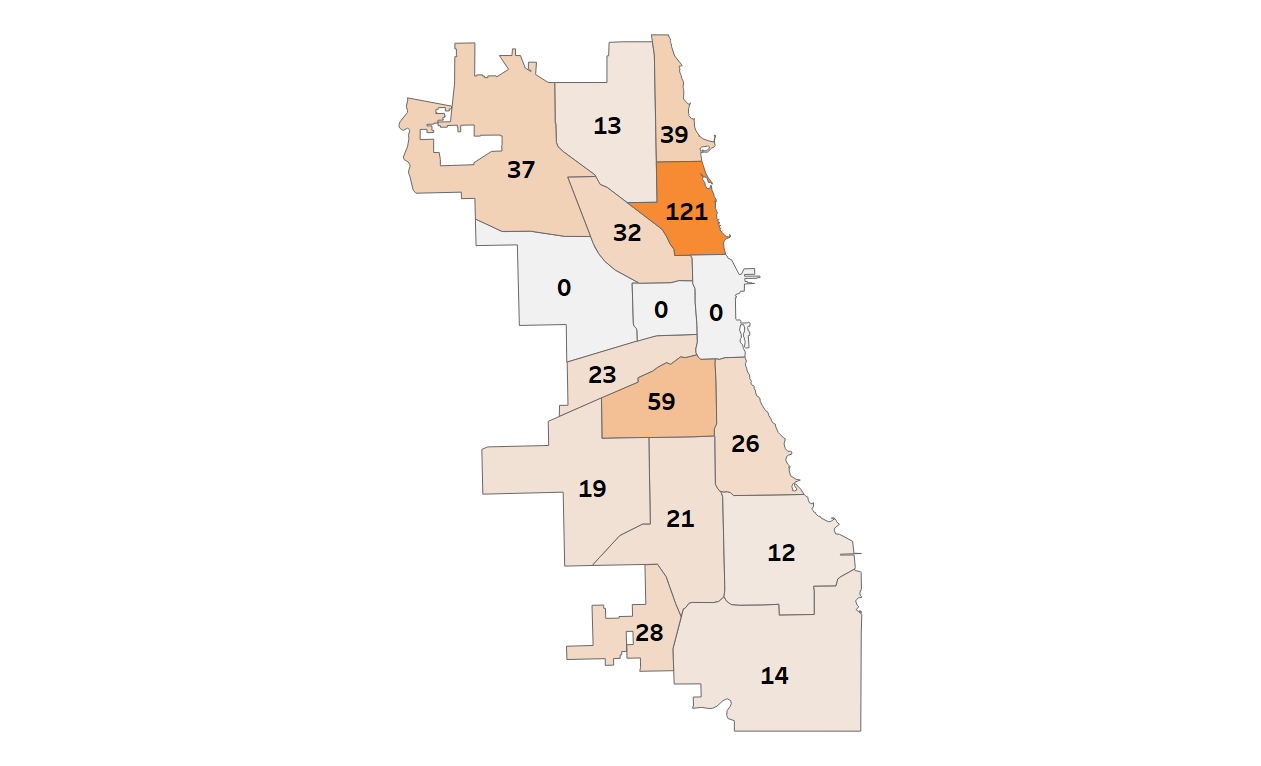
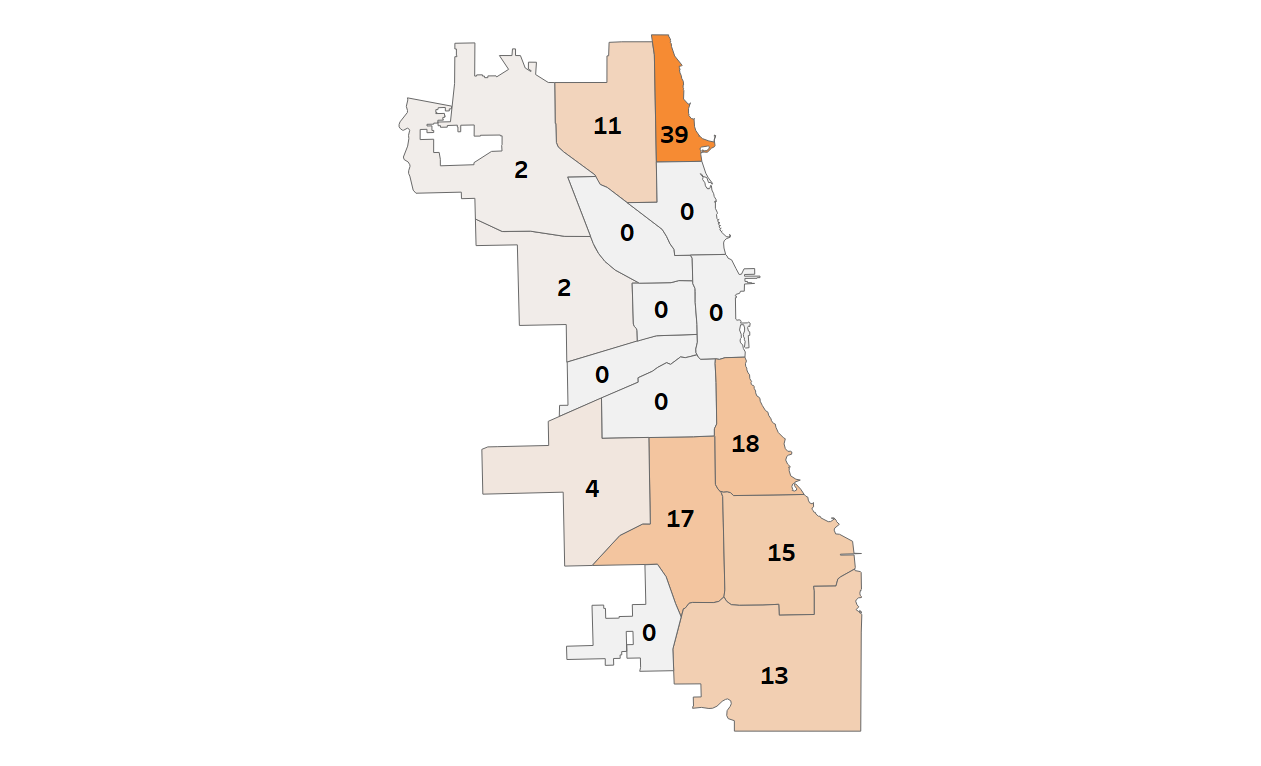
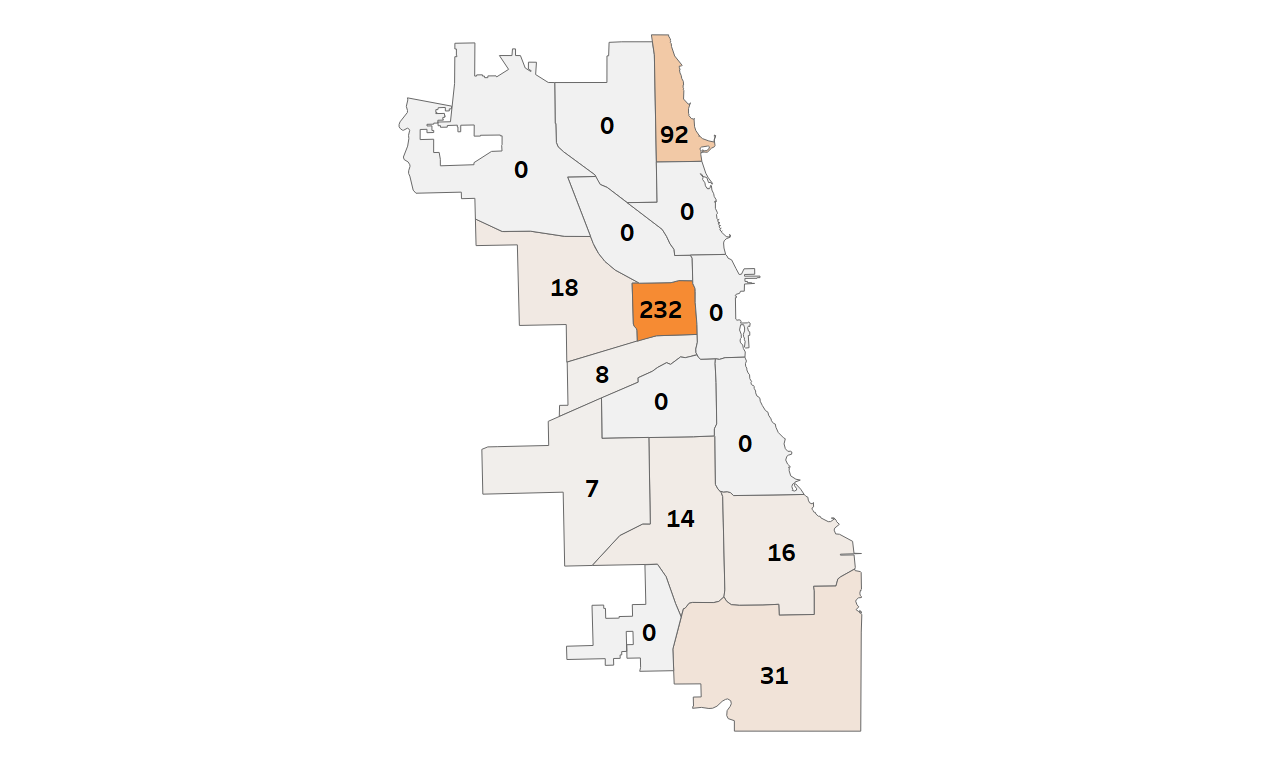
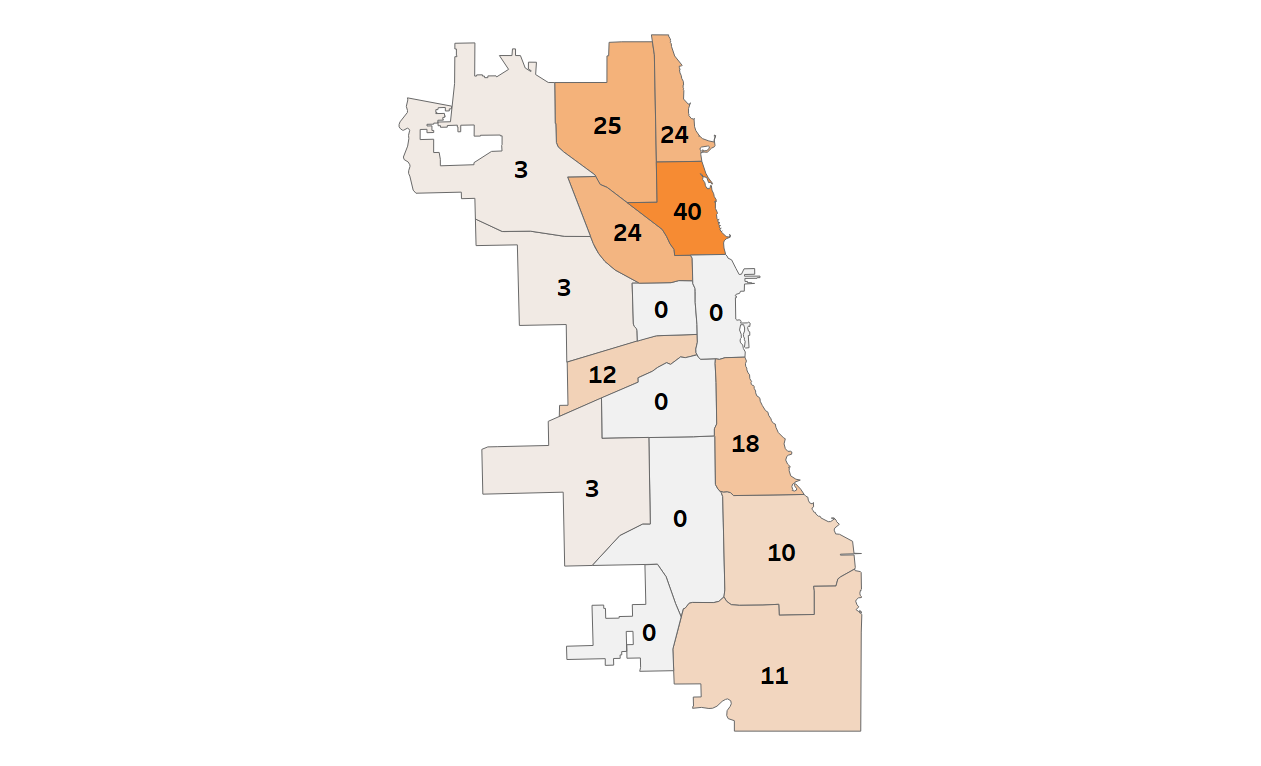
Options High School Students Residing and Enrolling Map and Table
| District-wide, 6.4% of high school students are enrolled in an Options high school.
This map illustrates where 9th-12th Options high school students reside across the district and where options schools are located.
MAP OF OPTIONS HIGH SCHOOL LOCATIONS AND WHERE OPTIONS HIGH SCHOOL STUDENTS RESIDE AND ATTEND
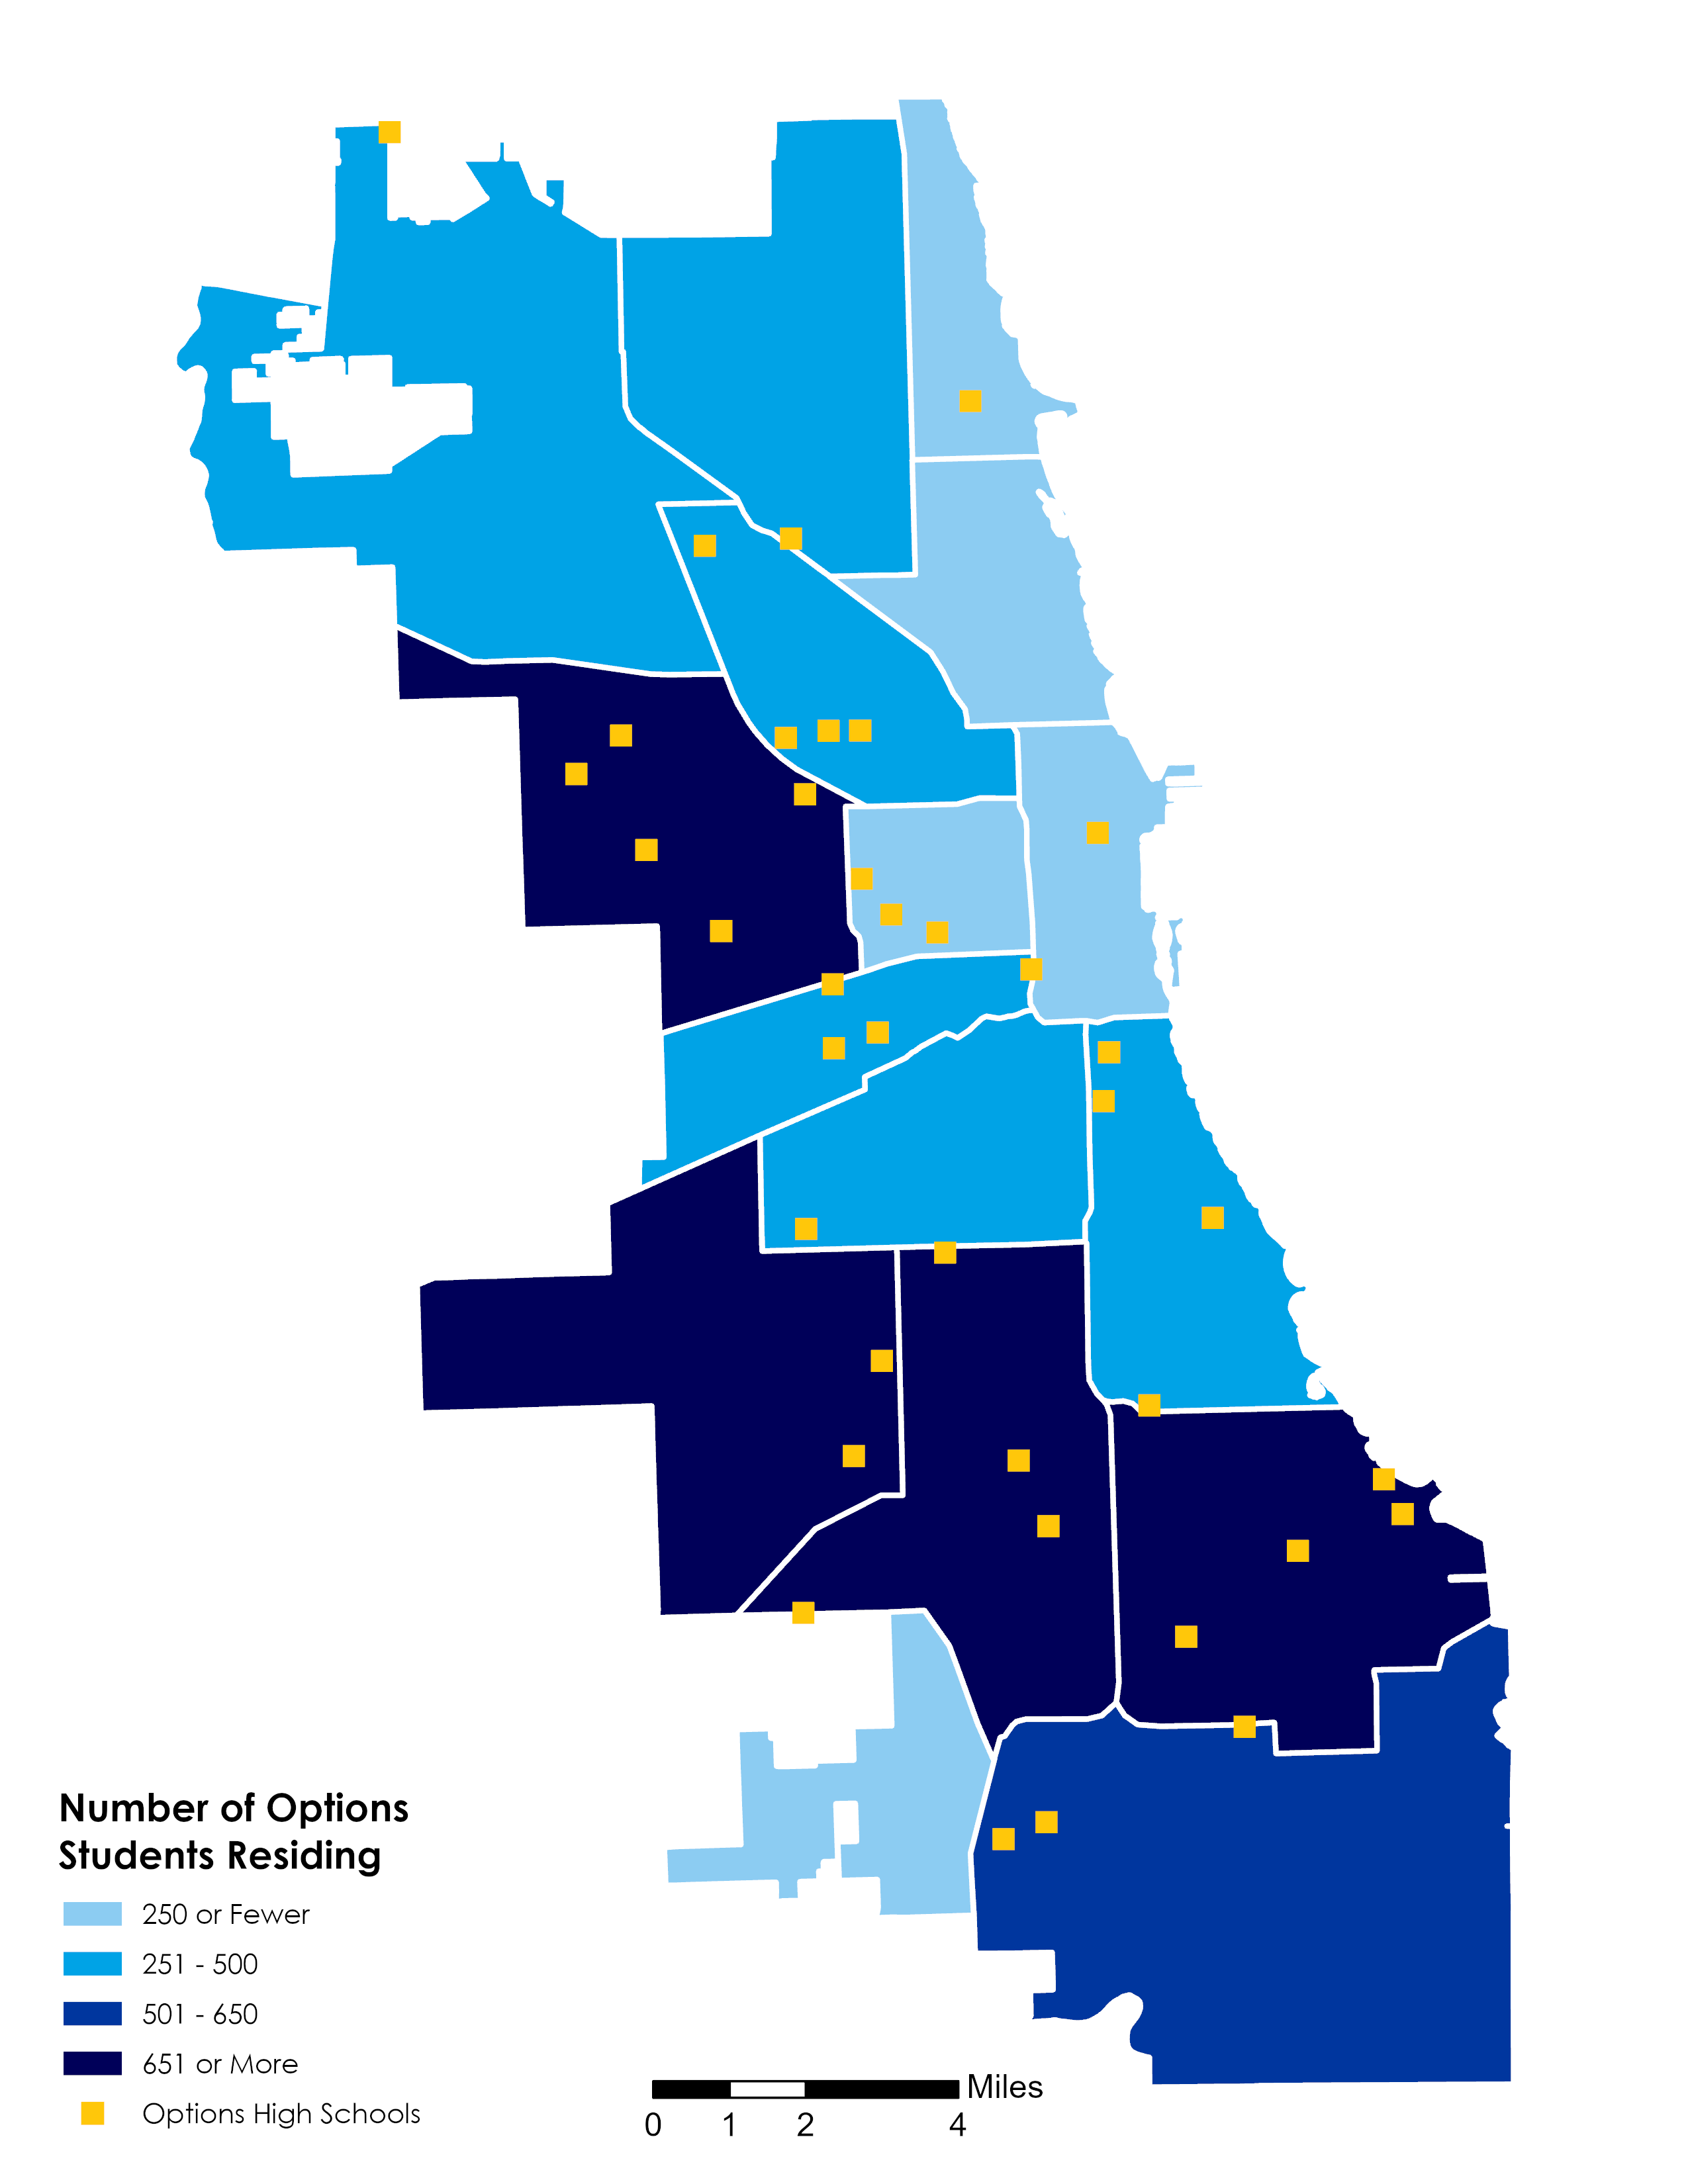
OPTIONS HIGH SCHOOL STUDENTS
# of HS Students Residing in Region that attend an Options HS
Share of HS Students Residing in Region that attend an Options HS
Greater Stony Island 801 11% South Side 922 11% Bronzeville / South Lakefront 496 10% West Side 1,030 9% Greater Calumet 627 9% Near West Side 93 8% Far Southwest Side 89 7% Pilsen / Little Village 294 6% Greater Midway 820 5% Greater Stockyards 317 5% Greater Milwaukee Avenue 256 5% North Lakefront 125 4% Northwest Side 341 3% Far Northwest Side 436 3% Central Area 33 3% Greater Lincoln Park 48 2% District 6,782 6%
Do Students Have Access to the Variety of Schools and Programs Offered?
-
Elementary Program Maps
The Program Density Index measures the density of certain academic programs in each region. The index is calculated as the number of program seats per 100 age-eligible CPS students who reside in the region. This index can be used to compare program availability across regions. For more information about types of programs, visit https://cps.edu/Pages/AcademicProgramRFP.aspx.
Most regions have either World Language Magnet/Magnet Cluster or Dual Language elementary programs. The Greater Milwaukee Ave, Pilsen / Little Village, and Greater Lincoln Park regions have the greatest density of language program seats. The Central Area, Far Southwest Side, and North Lakefront regions have neither types of language programs.
Dual Language
World Language
Selective Enrollment elementary programs (Regional Gifted Centers, Classical, and Academic Centers) are present in 13 regions. Selective Enrollment schools and programs admit students using a testing process.
Regional Gifted Centers/Classical
Academic Centers
All regions offer some elementary International Baccalaureate (IB) programming. The Far Southwest Side, Central Area, and Near West Side regions have the greatest density of program seats per students. Elementary IB programs have no admissions criteria.
Personalized Learning (PL) elementary programs are present in 12 regions. The Greater Milwaukee Avenue, South Side, and West Side regions have the greatest density of program seats per students. Elementary PL programs have no admissions criteria.
Elementary IB
Elementary PL
Science, Technology, Engineering, and Math (STEM) elementary programs include STEM, Science, Technology, Engineering, Arts, and Math (STEAM), Math, Science, Engineering, and Technology Magnet and Magnet Cluster programs. The Near West Side has the greatest density of program seats.
Magnet/Magnet Cluster Fine & Performing Arts programs are present in 15 regions. The Greater Lincoln Park, Central Area, North Lakefront and Near West Side regions have the greatest density of program seats.
Elementary STEM
Elementary Arts
Elementary Program Density Table
1. Programs listed do not have admissions criteria for enrollment.
2. Data regarding the presence of programs in charter schools or the number of seats in programs at charter schools may be missing or incomplete.
3. STEM elementary programs include STEM, STEAM, Math, Science, Engineering, and Technology magnet and magnet cluster programs. Schools may offer STEM programming outside of magnet schools/magnet cluster programs.
4. Personalized Learning is a learner-driven instructional model that fosters 21st century skills by empowering every student to actively co-design their learning path, pace, and environment according to their individual needs, strengths, and interests. This data includes schools that are on the path to schoolwide adoption of this approach.
5. Many schools offer arts programming outside of magnet schools/magnet cluster programs. Schools receive a Creative Schools Certification indicating the strength of their arts programming. More information can be found on each school’s profile page.
6. Other includes: Humanities, Math/Science, Math/Science/Technology, Montessori, Montessori/Fine & Performing Arts, Scholastic, and World Language and International Studies schools and programs.NOTE: Several elementary schools are currently incubating programs that are not included in the figures above.
The following elementary schools will begin Dual Language programming next school year: Davis N (Greater Stockyards).
The following schools will begin Fine & Performing Arts programming next school year: Bright (Greater Calumet) and Nash (West Side).
The following elementary school is incubating or is a candidate for authorization for the IB Primary Years program: Kilmer (North Lakefront).
The following schools will begin STEAM programming next school year: Ruggles (Greater Stony Island) and West Park (West Side).
The following elementary schools will begin STEM programming next school year: Hernandez (Greater Midway). -
High School Programs Maps
The Program Density Index measures the density of certain academic programs in each region. The index is calculated as the number of program seats per 100 age-eligible CPS students who reside in the region. This index can be used to compare program availability across regions. For high school programs, this index is calculated using the number of seats available for 9th grade via the GoCPS application process and the number of 9th graders who reside in the region. For more information about types of programs, visit https://cps.edu/Pages/AcademicProgramRFP.aspx.
High School International Baccalaureate (IB) programs are present in 13 regions. The greatest density of IB seats are in the Greater Stockyards, Greater Lincoln Park, and North Lakefront regions. The Central Area, Near West Side, and West Side regions have no high school IB programs. High school IB diploma programs have admissions criteria.
Personalized Learning (PL) high school programs are present in 9 regions. The North Lakefront, Bronzeville / South Lakefront, and South Side regions have the greatest density of program seats. High school PL programs have no admissions criteria.
High School IB
High School PL
Science, Technology, Engineering, and Math (STEM) high school programs are in 8 regions. The Near West Side and North Lakefront regions have the greatest density of program seats. Many schools may offer STEM programming outside of magnet schools/magnet cluster programs and early college STEM schools.
Fine & Performing Arts high school programs are available in 11 regions across the city. The Greater Lincoln Park and North Lakefront regions have the greatest density of program seats.
High School STEM
High School Arts
Career & Technical Education (CTE) high school programs are relatively dispersed throughout the city. All regions offer some type of CTE programming except for the Greater Lincoln Park region. Some CTE programs have admissions criteria, but others are open enrollment.
Military high schools have specific admissions criteria and are in six regions, with those regions relatively spread out across the district. There are 39 traditional Junior Reserve Officer Training Corps (JROTC) programs in high schools across nearly all regions. The Central Area region is the only region that does not have a military or JROTC program.
Career & Technical Education (CTE)
Military & JROTC
There is disparity in Selective Enrollment high schools and program availability and density throughout the city – the Central Area, Near West Side, Bronzeville / South Lakefront, and Northwest Side regions have a high concentration of Selective Enrollment seats. Selective Enrollment programs have admissions criteria.
Selective Enrollment
High School Program Density Table
1. Selective Enrollment, Military, and IB programs have admissions criteria for enrollment.
2. Data regarding the presence of programs in charter schools or the number of seats in programs at charter schools may be missing or incomplete.
3. Many schools may offer STEM programming beyond those designated as Early College STEM schools.
4. Personalized Learning is a learner-driven instructional model that fosters 21st century skills by empowering every student to actively co-design their learning path, pace, and environment according to their individual needs, strengths, and interests. This data includes schools that are on the path to schoolwide adoption of this approach.
5. Many schools offer arts programming outside of these specific Fine and Performing Arts programs. Schools receive a Creative Schools Certification indicating the strength of their arts programming. More information can be found on each school’s profile page.
6. Other includes: AVID, Dual Language, Journalism, Science, Three-Year HS, and World Language and International Studies schools and programs.
How Does Student Demand Compare to Current Program Seats?
-
Since 2017-18, CPS has utilized the GoCPS platform to allow students to research and apply to all high schools and high school programs. Students are asked to rank in order of preference the schools and programs they are most interested in. Students are still guaranteed a seat in the general education program at their zoned high school and do not have to submit a GoCPS application for that program. For more information about the GoCPS and the high school application process, visit go.cps.edu.
This graph shows the high school program choices that were ranked as student's first choice using the GoCPS application. This graph compares the number of applications to different programs and the total number of seats in those programs, district-wide. In 2020-21, students submitted 6,252 applications ranking a Career and Technical Education (CTE) program as their first choice, 4,424 applications ranking an International Baccalaureate (IB) program as their first choice, and 3,514 applications ranking a Science, Technology, Engineering, and Math (STEM) program as their first choice.
NUMBER OF APPLICATIONS VS. NUMBER OF AVAILABLE SEATS BY GOCPS PROGRAM TYPE
- Career & Technical Education (CTE)
- Fine & Performing Arts
- Internation Baccalaureate (IB)
- Military/JROTC
- STEM
NOTE: Not all programs are available in all regions. GoCPS application data is not an indicator of which programs students enroll in.
Do Students Have Access to the Variety of Schools and Programs Offered?
-
Early College and Career Credential Access
Early College and Career Credential (ECCC) programs provide access and support for rigorous, college-level, hands-on, and career-focused courses and experiences. ECCC programs advance student postsecondary success through earned college credits or professional credentials and the exposure to soft skills needed to succeed in college, civic life, and the 21st-century labor market.
There are 7 different ECCC programs available to CPS students, including:
- Advanced Placement (AP)
- Career & Technical Education (CTE)
- Dual Credit (DC)
- Dual Enrollment (DE)
- International Baccalaureate (IB)
- Junior Reserve Officer Training Corps (JROTC)
- Seal of Biliteracy (SSB)
CPS has set an ambitious goal that 60% of students will earn an Early College and Career Credential by the time they graduate and considers ECCC rates to be a measure of student preparedness for postsecondary success.
In 2020-21, 46% of students across CPS earned an ECCC. Of the 7 ECCC programs, students across CPS earn the most credentials in Advanced Placement (26% of students) and Dual Credit (13%) programs last school year.
Career & Technical Education (CTE) high school programs are relatively dispersed throughout the city. All regions offer some type of CTE programming except for the Greater Lincoln Park region. Some CTE programs have admissions criteria, but others are open enrollment.
Career & Technical Education (CTE)
Military high schools have specific admissions criteria and are in six regions, with those regions relatively spread out across the district. There are 39 traditional Junior Reserve Officer Training Corps (JROTC) programs in high schools across nearly all regions. The Central Area region is the only region that does not have a military or JROTC program.
Military & JROTC
High School International Baccalaureate (IB) programs are present in 13 regions. The greatest density of IB seats are in the Greater Stockyards, Greater Lincoln Park, and North Lakefront regions. The Central Area, Near West Side, and West Side regions have no high school IB programs. High school IB diploma programs have admissions criteria.
High School IB
NOTE: Program density calculations are only available for CTE, JROTC, and IB ECCC programs. Program density calculations do not include schools that have been approved but not yet implemented.
To learn more about AP, visit www.cps.edu/academics/college-credit/ap-credit. To learn more about CTE, DC, and DE programs, visit www.cps.edu/about/departments/early-college-and-career-education-ecce. To learn more about IB, visit www.cps.edu/academics/college-credit/ib-credit. To learn more about JROTC, visit www.chicagojrotc.com. To learn more about SSB, visit www.cps.edu/academics/language-and-culture/seal-of-biliteracy.
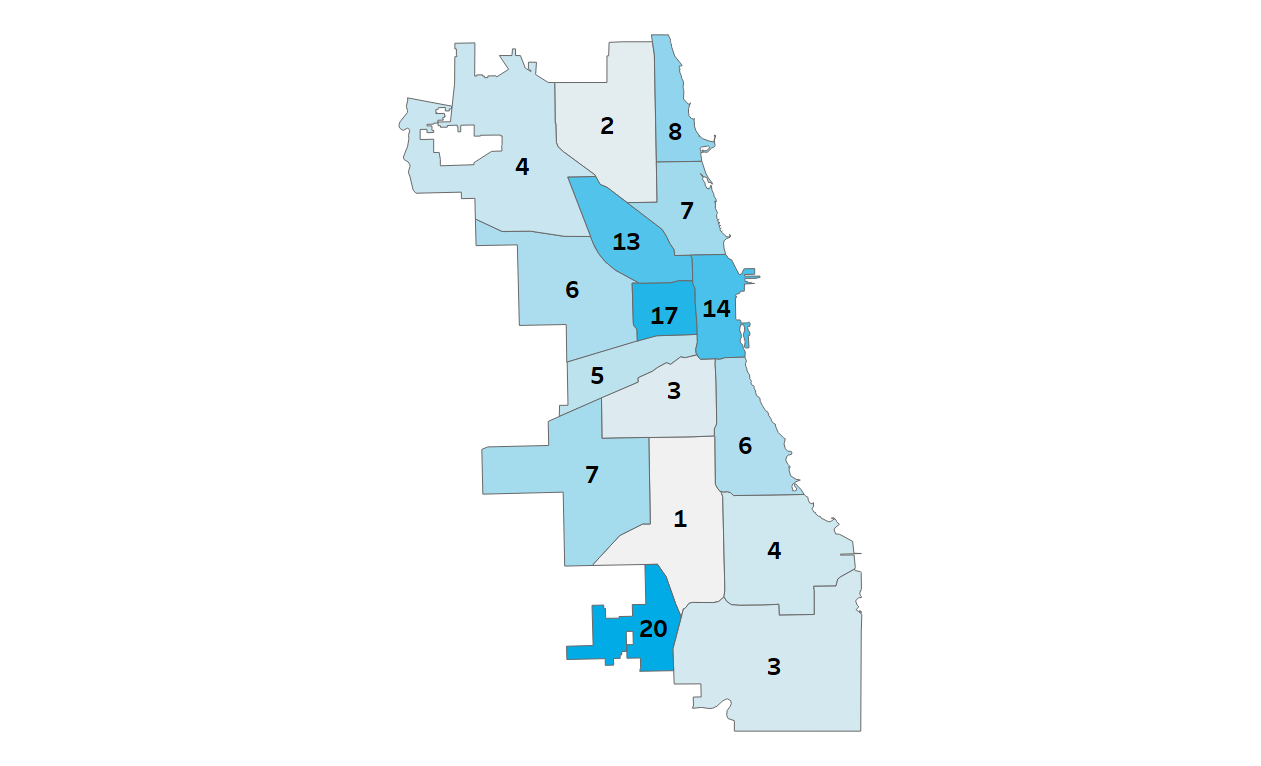
Early College and Career Credential Achievement
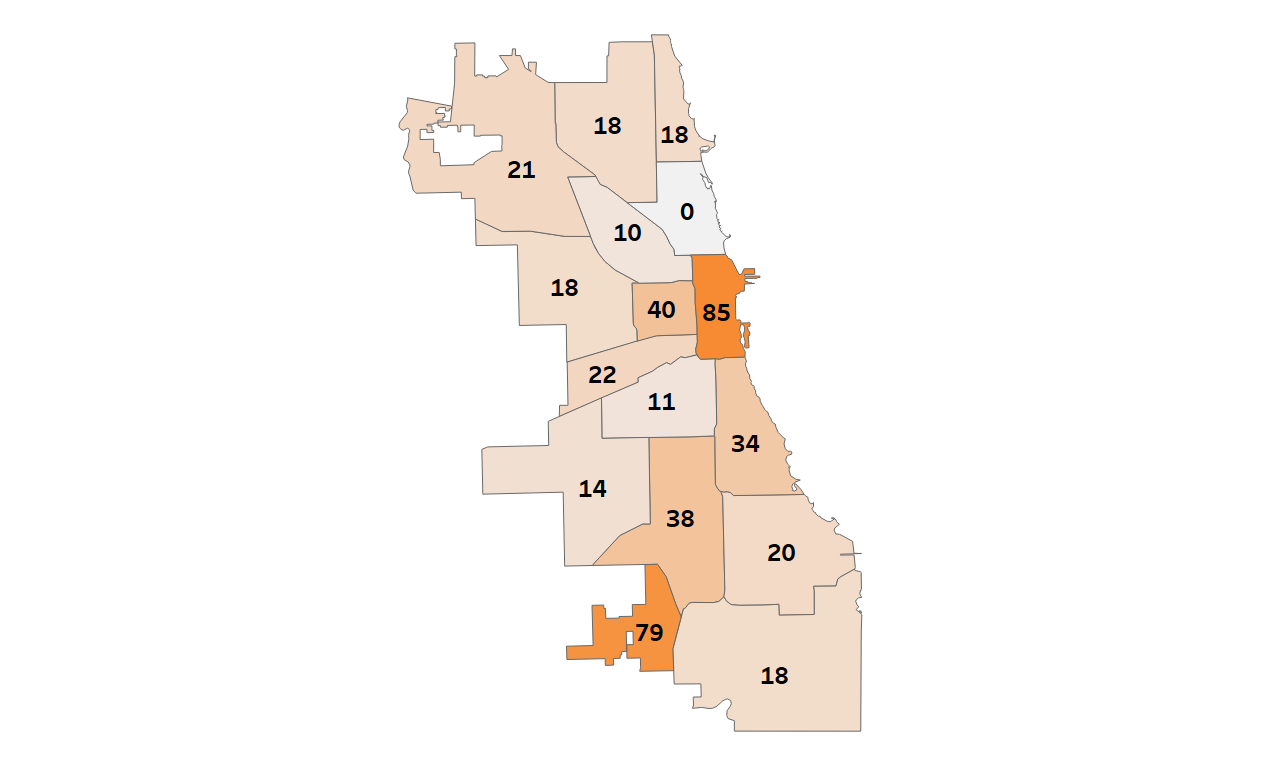
ECCC Achievement Rate by Home Region
The greatest percentage of students earning an Early College and Career Credentials live in the Greater Lincoln Park region and the lowest percentage live in the West Side region. The greatest overall number of students earning an ECCC live in the Far Northwest Side region (1,699) and the least live in the Near West Side region (89).
ECCC ACHIEVEMENT RATE (%) BY HOME REGION
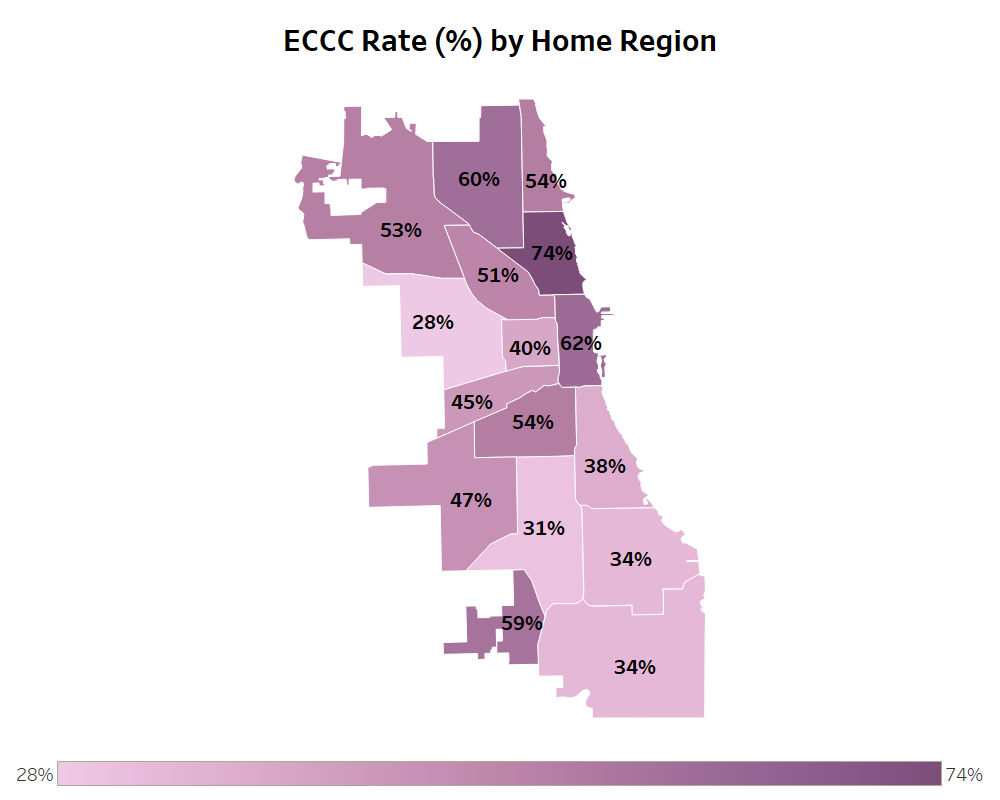 NOTE: Students can earn an ECCC in more than one program. The number of students shown in each region counts each student earning an ECCC only once regardless of if they earned more than one credential.
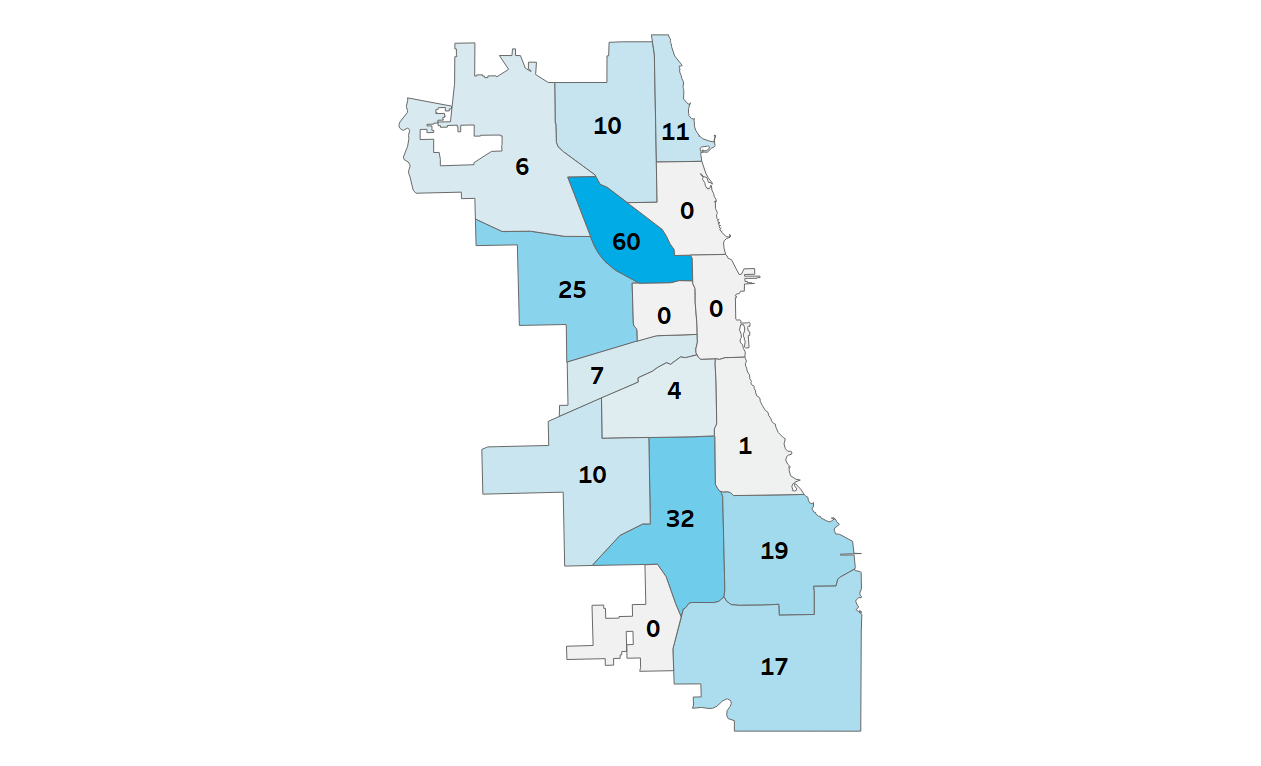
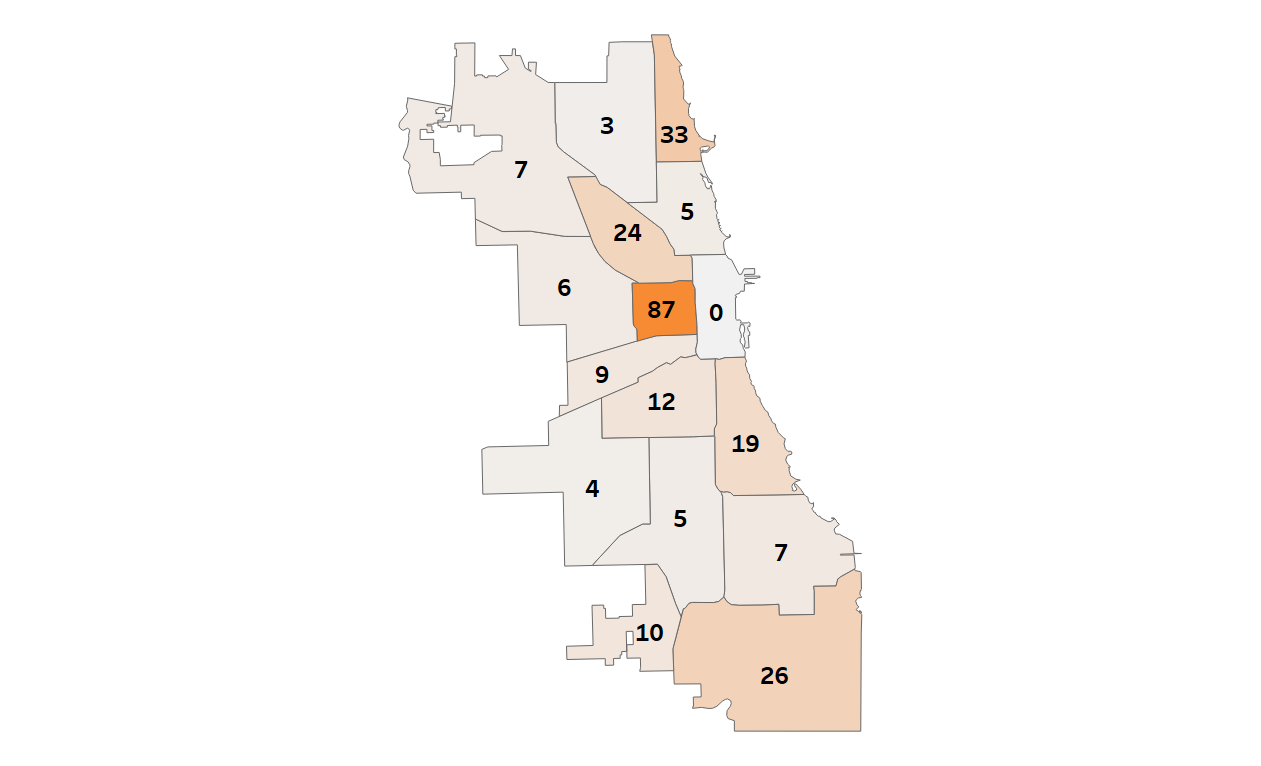
 ECCC Achievement Rate by Attending Region
The greatest percentage of students earning an Early College and Career Credentials attend school in the Central Area region and the lowest percentage attend school in the South Side region. The greatest overall number of students earning an ECCC attend school in the Northwest side region (1,974) and the least attend school in the Far Southwest Side region. (157).
ECCC ACHIEVEMENT RATE (%) BY ATTENDING REGION
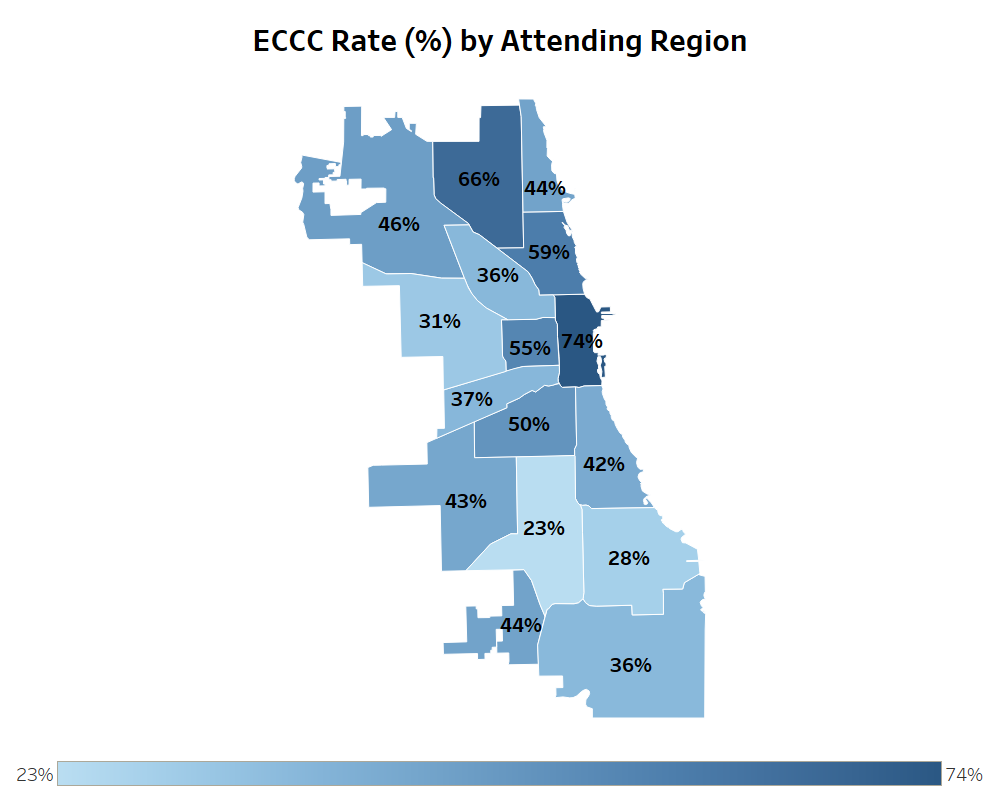 NOTE: Students can earn an ECCC in more than one program. The number of students shown in each region counts each student earning an ECCC only once regardless of if they earned more than one credential.
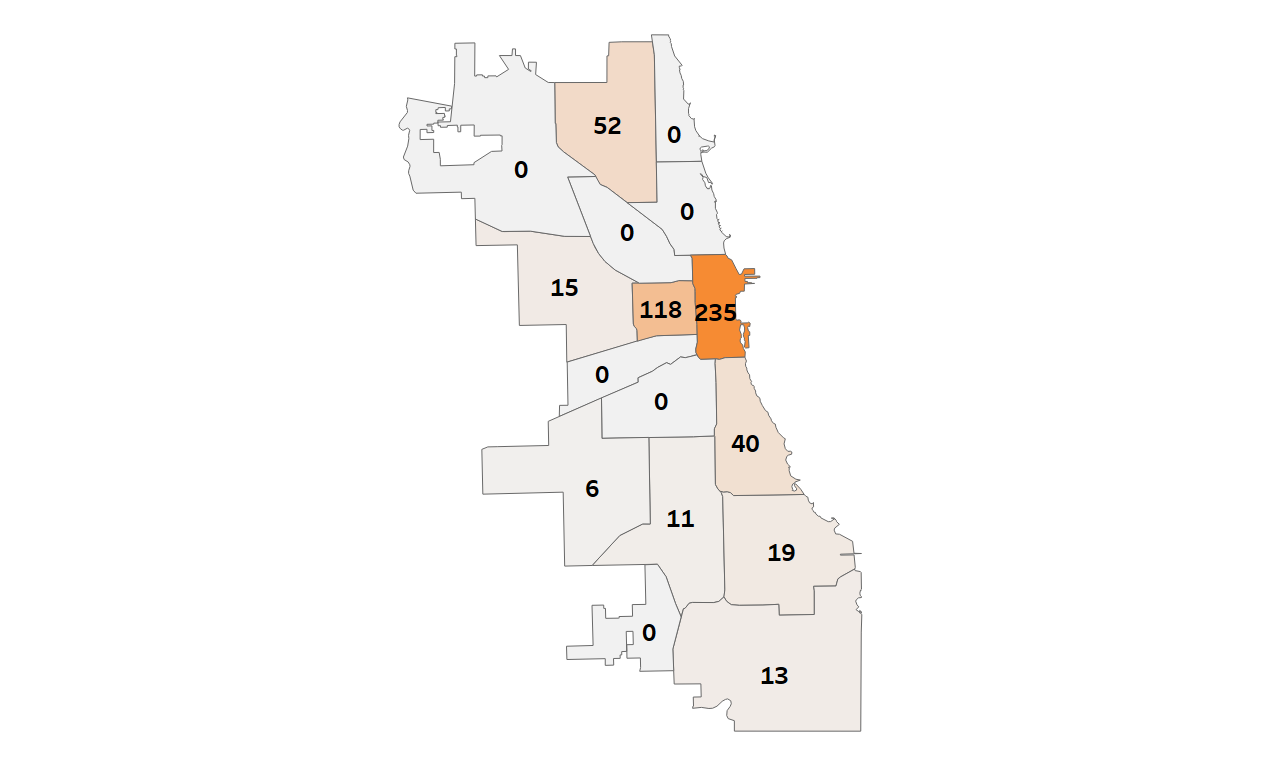
 ECCC Achievement Rate per Program by Home and Attending Region
| District-wide, 5,893 high school students earned an ECCC in AP
| District-wide, 2,927 high school students earned an ECCC in Dual Credit
Each ECCC program sets their own credential achievement criteria. To learn more, go to cps.edu/about/district-data/metrics.
ECCC ACHIEVEMENT RATE PER PROGRAM BY HOME REGION
APDCDESEALIBCTEJROTC
ECCC ACHIEVEMENT RATE PER PROGRAM BY ATTENDING REGIONAPDCSEALDEIBCTEJROTCNOTE: Percentages shown are the portion of students that earned an ECCC in each program. Bars will not add up to 100% since students can earn an ECCC in more than one program. Students who earned more than one ECCC are counted in each program percentage.
Regions are in alphabetical order and programs are in descending order based on the percentage of credentials earned at the district level.
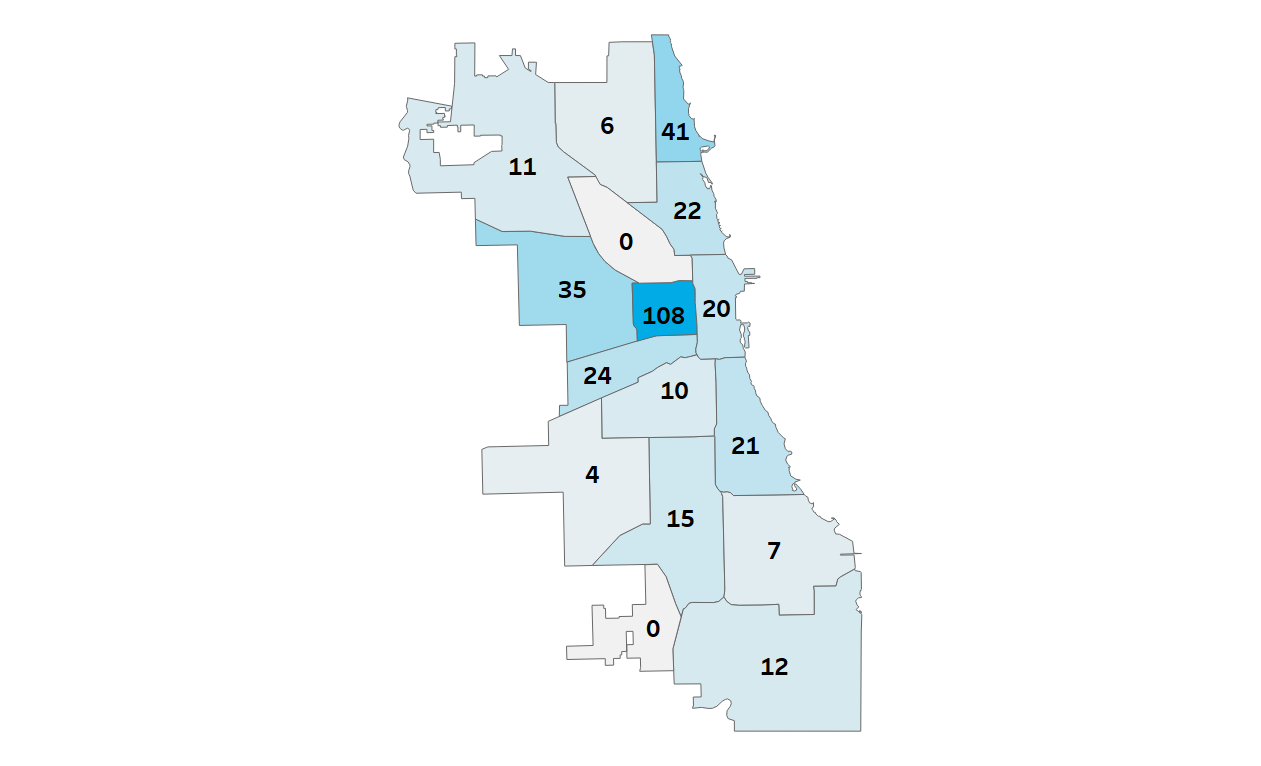
-
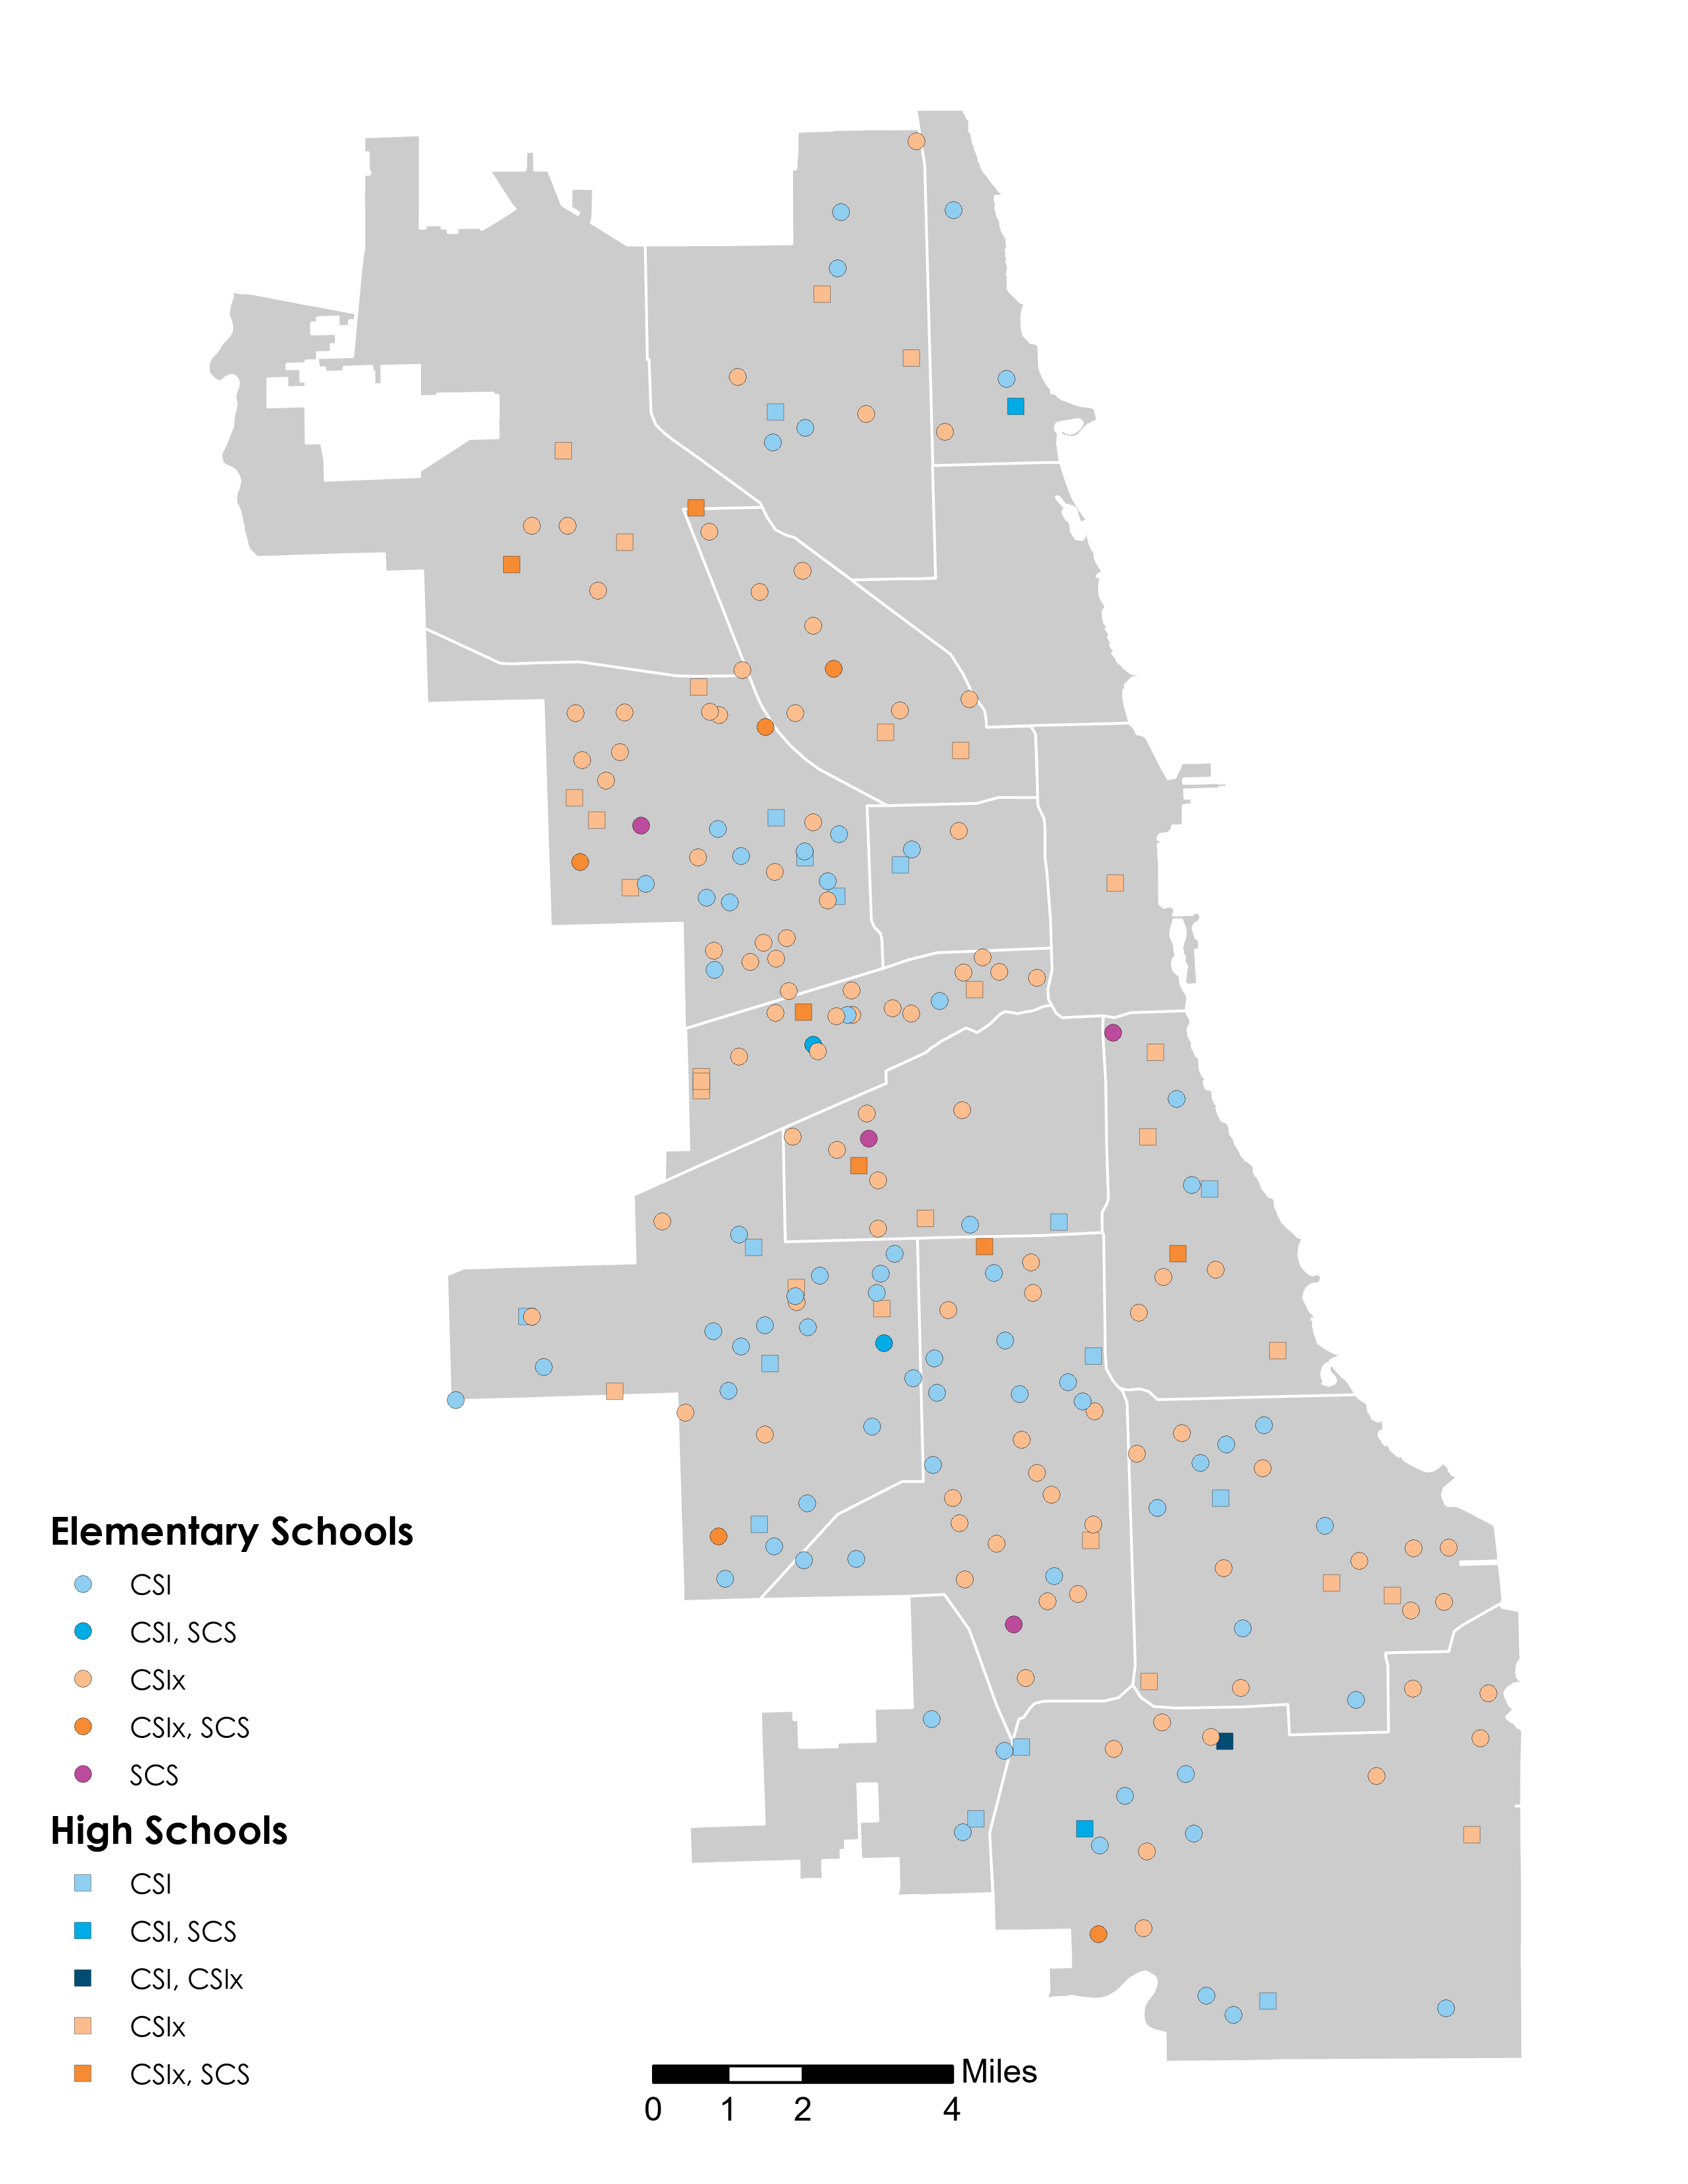
Chicago Public Schools manages one of the largest community school systems in the nation, known as the Community Schools Initiative (CSI), which supports 213 schools in partnership with more than 40 leading non-profit organizations. For more information about CSI, visit cps.edu/about/departments/community-schools-initiative.
CSI Goals are to:
- Transform and maintain selected public schools to become the centers of their communities, with campuses open mornings, afternoons, evenings, weekends and into the summer
- Connect children and families to a range of services that foster individual and economic well-being
- Counteract the effects of a range of negative factors that contribute to students’ lack of opportunities and underachievement
- Engage parents and the community to improve academic achievement
CSI serves 29,233 students and 7,329 parents across three different models:
- 21st Century Community Learning Centers, (CSI 21st CCLC): District-Managed
- CSI External Partnerships (CSIx): Partner Agency-Managed, awarded grants with CPS as co-applicant
- Sustainable Community Schools (SCS): Partnership with Chicago Teachers Union
MAP OF COMMUNITY SCHOOLS AND PROGRAMS