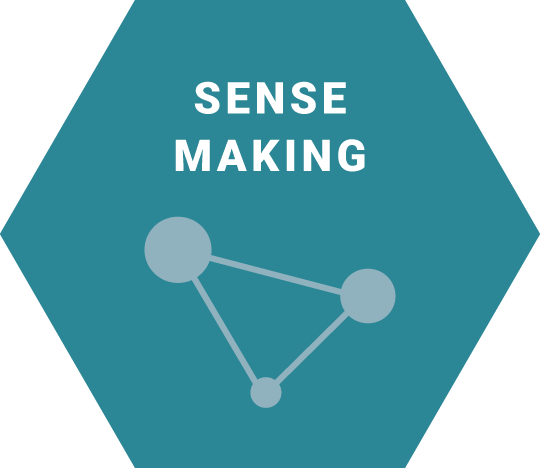
What is Sense Making?
Sense Making captures the activities that will help you gain a deeper understanding of a large amount of data collected, whether it be notes from interviews and observations, or lots of loose ideas from an idea-generation exercise. This module will provide you with a rigorous approach to interpret individual data points to identify insightful patterns through similarities, differences and alignment.
Why is it important?
Sense Making helps provide meaning to data or collective experiences. Without Sense Making, you or a member of your team may only remember a few specific data points that stand out, and your own biases may nudge you to assume that those are the most important things to pay attention to. You may also be overwhelmed by all the data captured and get lost in what is commonly known as “analysis paralysis” wherein you are unable to move forward with a decision as a result of overanalyzing data or overthinking a problem. Sense Making is important because it allows people to have a better understanding of what is going on.
Methods
Affinity Clustering, Themes, and Insights
Organize numerous individual data points (which may come from research or ideation) based on qualities that make them similar or complementary, and derive meaningful, provocative themes from the data.
Overview
This activity involves collaboratively clustering individual data points (which could be notes from Observation or Interviews conducted in the Listening module, or ideas generated in the Ideating module) to arrive at new and useful meaning. This process will help you convert individual data points into meaningful and actionable insights, develop a point of view on what is most important for your target audience, and give you direction for how to prioritize new opportunities.
This method has two parts.
- Affinity Clustering and Themes: Sort data and findings into clusters that reveal connections between the pieces of data. Then, name each cluster and assign it a theme.
- Insights: Generate statements about human behavior drawn from your data points.
Exercises
Part 1: Affinity Clustering and Themes
This set of steps will help organize many individual data points into small and manageable sets of clusters, organized by certain common characteristics, which we call Themes.
- Begin by making all of the relevant data points visible. This includes notes, photographs, quotes, diagrams, and any other artifacts gathered during Listening. It could also be ideas or artifacts generated during Ideating. Make sure that you can trace each data point back to the person/people it represents or to the member of your team that captured it. You can do this by writing the corresponding community member or team member’s initials at the end of each note, or by using sticky notes of a different color for each individual or group of stakeholders represented.
- Pin these to a wall, large sheet of butcher paper or flip charts, or foam-core boards. This process can often take up entire walls or rooms, so it’s a good idea to have a dedicated project room if doing it in-person. If you are doing this virtually, consider using software like Miró, Mural, or Microsoft Hubs where you can digitally record and move around data. Excel is also an option, but does not have the same visual benefits as the other tools.

- Look for patterns of meaning across peoples’ experiences, moving from what we know to what we think we understand.
- Choose one piece of data. Consider the meaning behind the statement.
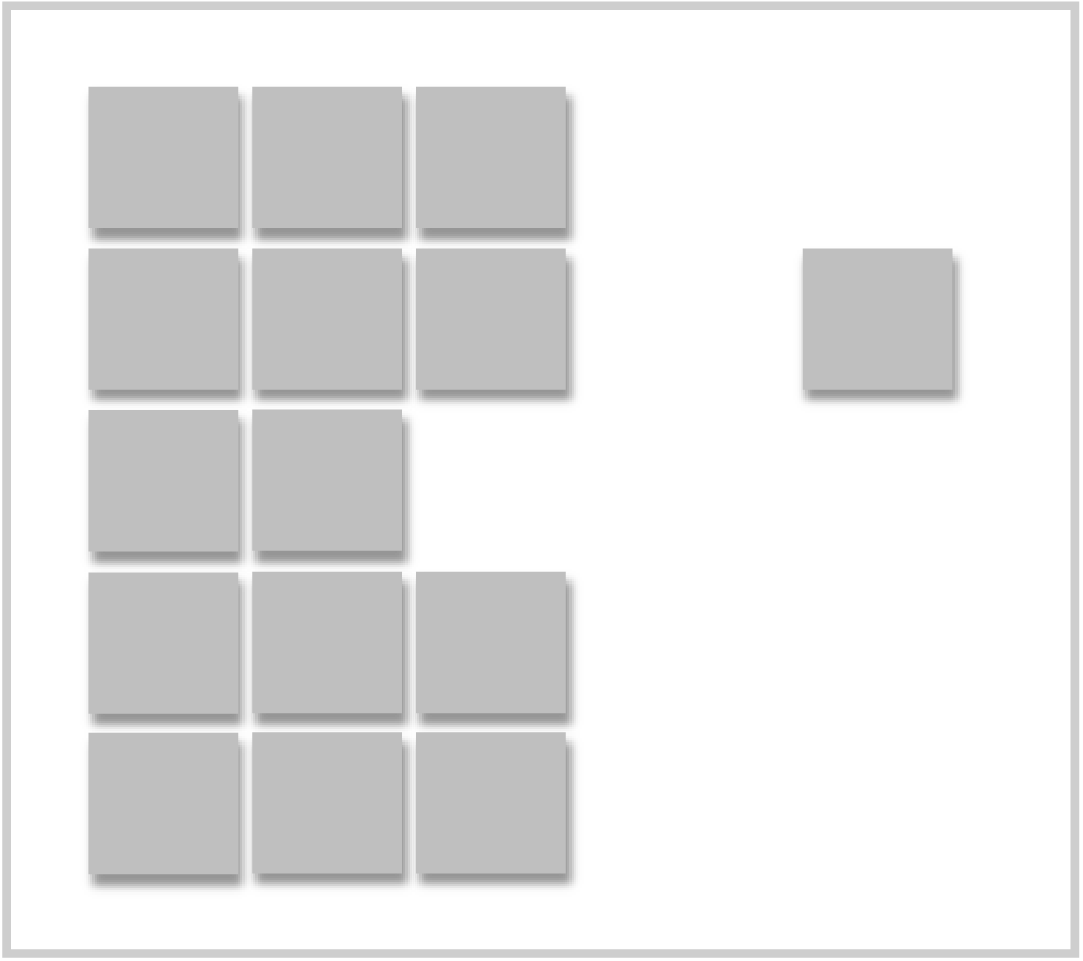
- Choose a second piece of data and compare the two. Can you draw a connection?
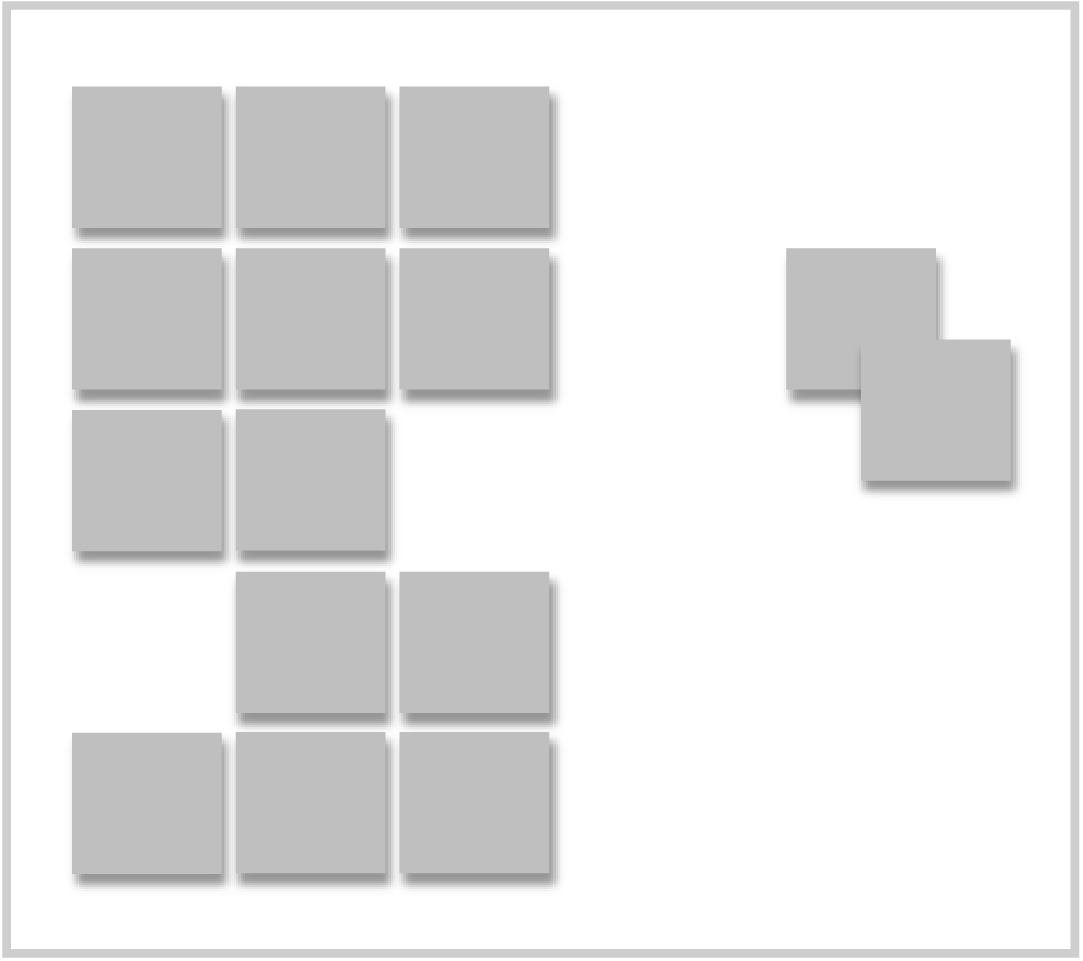
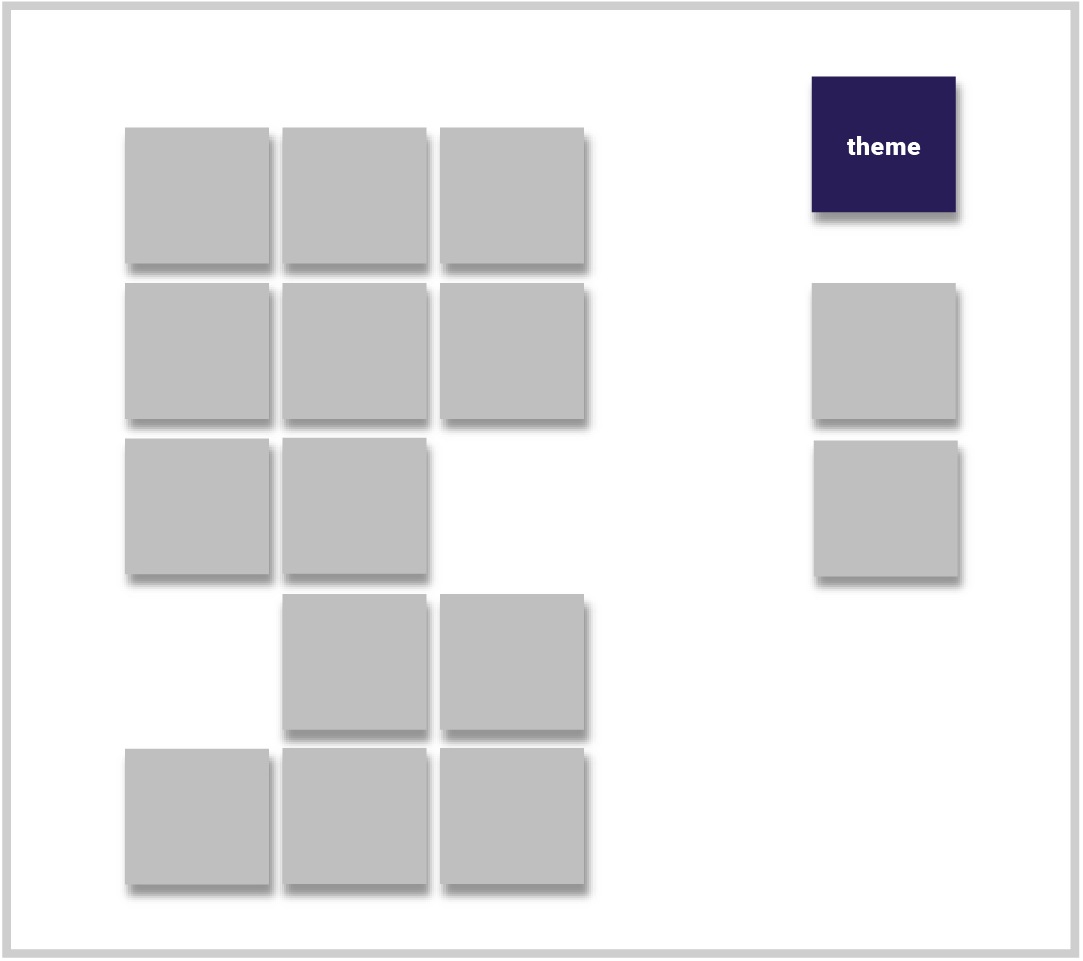
- On a piece of paper, capture the relationship in 1-3 words (this is what we call a theme), and place it next to the 2 notes that it relates to. You will be adding more pieces of data to this theme as you go.
- Choose a third piece of data. If it easily fits with the existing theme, place it in the group. If not, compare it with a fourth piece of data and start a new cluster.
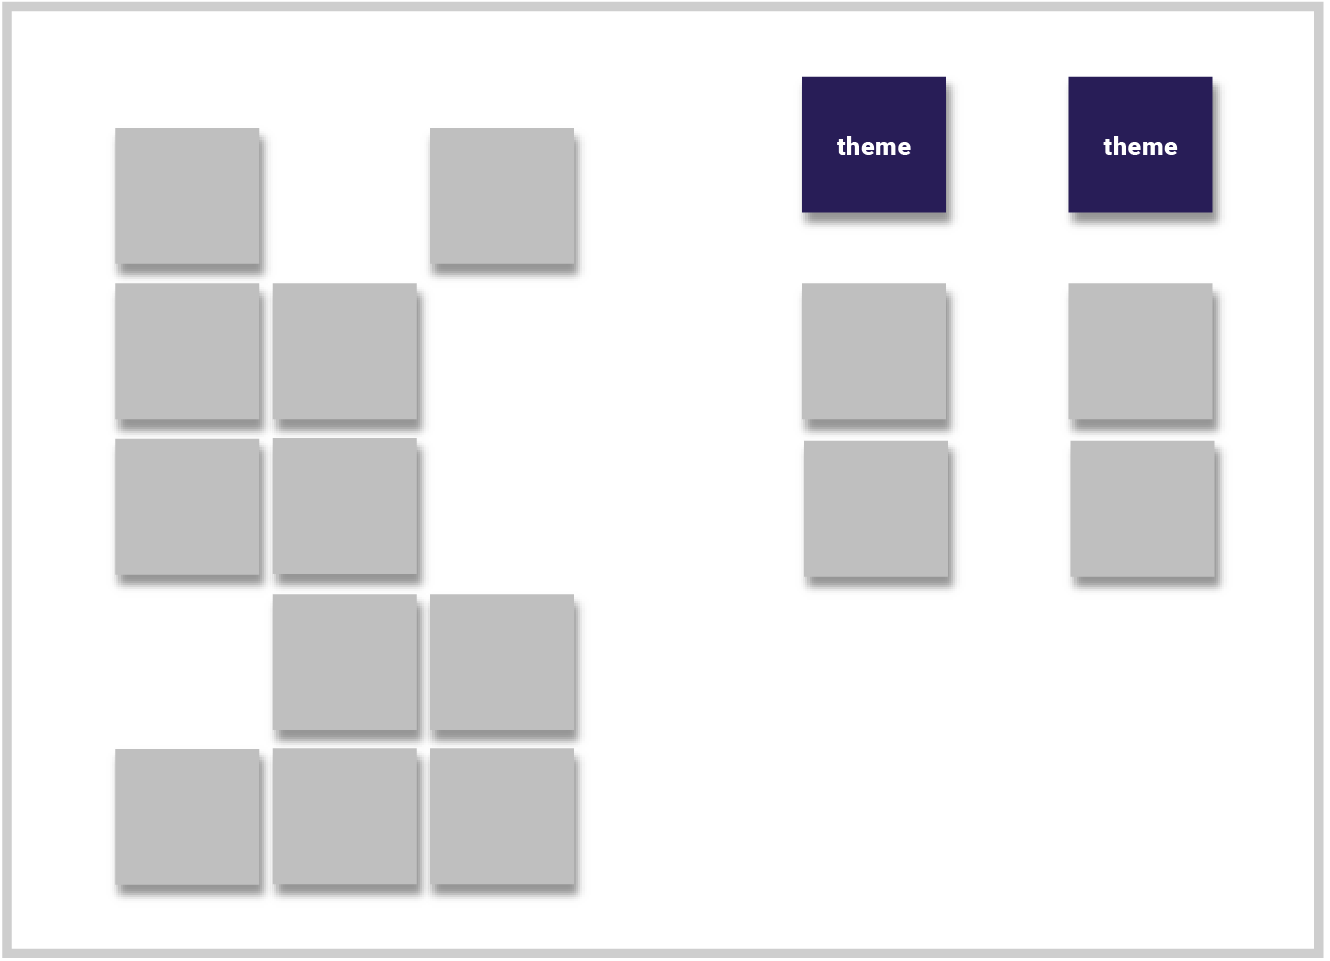
- Repeat until you’ve worked through all the data. The most compelling themes will connect at least three pieces of data.
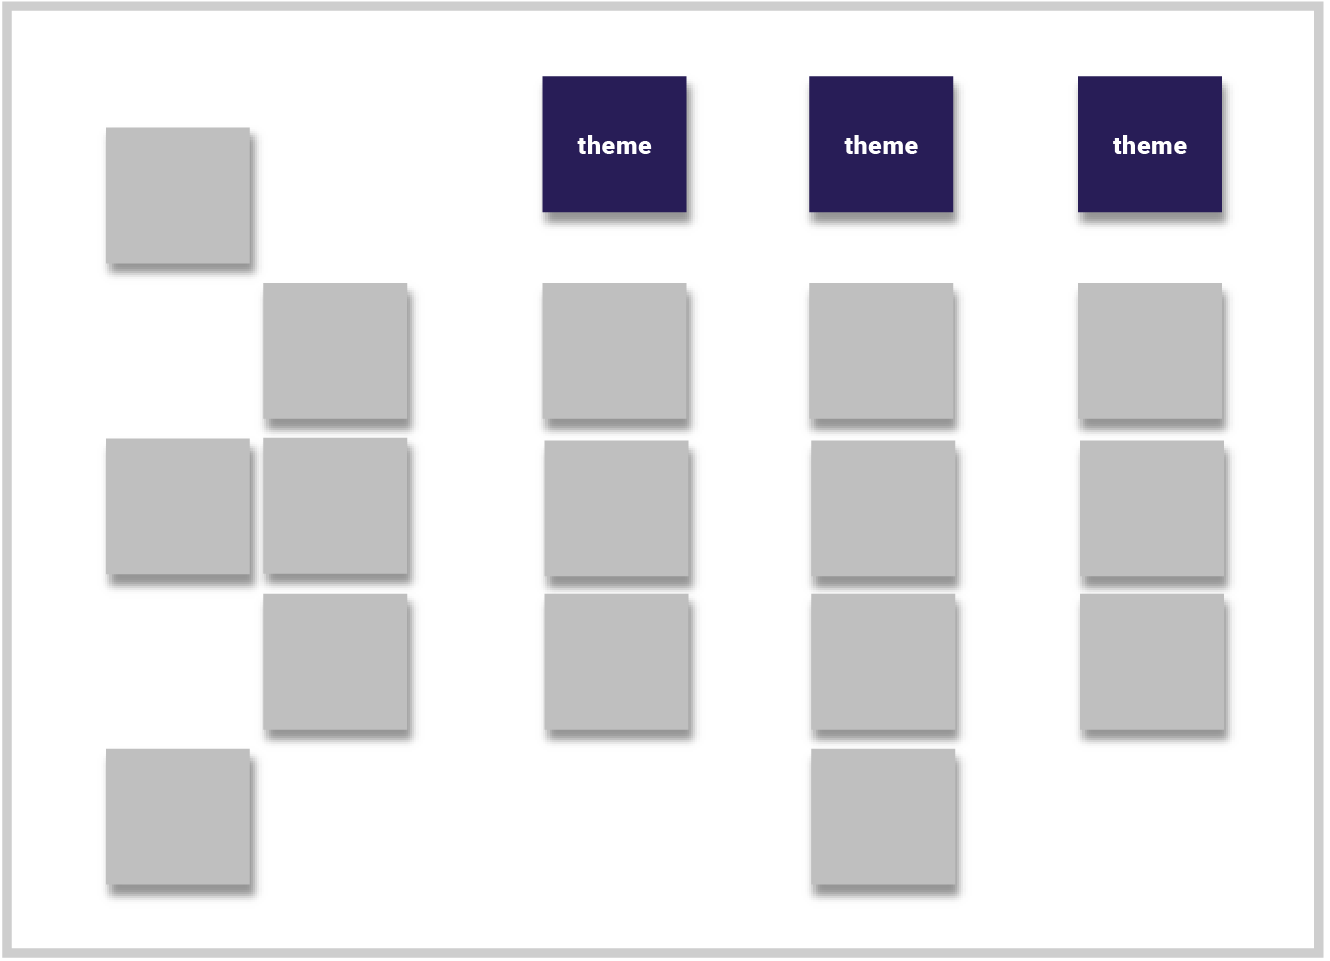
- Keep an eye on your themes with two pieces of data. If it is only made from two pieces of data, the theme likely doesn’t represent a larger pattern of experience, so it will not be meaningful. If you have no more to add, break the theme apart and return the pieces of data to the “pile.”
- Keep an eye on your themes as they grow. If made from a lot of data, the theme likely over-generalizes a pattern of experience and is too broad. This will likely not be meaningful, so be careful not to include too many. If themes get too big, break them apart to form smaller clusters. Return any unused data points to the “pile” and see if any are more appropriate for another cluster.
- Revisit your themes. Reflect on the connections between the data points in each cluster. Rewrite each final theme as one or two short sentences that explain the connections in a meaningful way.
Here's an example:
Quote 1Participant: Adam I think the community needs a school that will have big spaces to host extracurricular activities or that can be rented out for local community groups. |
Quote 2Participant: Kelsey I am concerned about the school sitting vacant for a long period of time. I think that before we close the school we need a plan for what to do with these big spaces and figure out how they can be useful to the community. |
Quote 3Participant: Cassandra Maybe there is an opportunity for the school to make money by renting out some of its big spaces. I know there are a lot of businesses in the neighborhood looking for big flexible spaces to rent. |
A poorly named theme from connecting these two quotes would be “big spaces” as this represents what we call “keyword matching.” It’s a very simple way to make sense of data that doesn’t help us identify anything meaningful about people’s behaviors. You should avoid simply listing things that are similar, like “big spaces.”
A good initial, three-word theme that could emerge from putting these two notes together is “Community multi-purpose space” - three words that suggest commonality between these three people.
imagine that by the end of the activity you have added one or two more notes to this cluster about “Community multi-purpose space.” This is a great theme: it represents a specific pattern of behavior or emotion of some of the people that we spoke to.
Additionally, notice in this example how each sticky note is of a different color and the participant names are written at the top, making it very easy to track the data points as they move around.
Part 2: Insights
Use your themes to develop insights: these are big, emotional statements about human behavior. Insights emerge from the interpretation of observations and the discovery of previously unseen patterns. Insights are not merely summaries of findings; they should represent a unique point of view or perspective. They should help you and others see the problem in new ways, whether it be highlighting previously unseen behaviors, emotions, motivations, or beliefs, or causing people to question the status quo and reexamine existing conventions.
In Part 2 of this method, you will create insights from the themes you created in Part 1. An insight is a provocative statement about human behavior. A provocation is a statement intended to capture the emotionally charged issue in a way that inspires someone to action. We want people to consider an issue in a way they haven’t thought of before.
Data
Data
Insight
Observed Theme
- Select a theme you’ve created.
- Ask “why?”
1
Participant: Adam
I think the community needs a school with big spaces like a gym or an auditorium that can host extracurricular activities or be loaned to local community groups.
2
Participant: Kelsey
I am concerned about the school sitting vacant for a long period of time. I think that before we close the school we need a plan for what to do with these big spaces and figure out how they can be useful to the community.
Why does the community value large multi-purpose spaces?
Theme:
Large multi-purpose spaces are valued by the community
- Use the data points and your own perspective to answer “why.” Your perspective allows you to look beyond what the data tells you. Since it might also bring out your own biases and personal beliefs, it is important to do this activity with other people.
A good insight is made of three sentences: - Sentence 1: Describes a current situation
- Sentence 2: Describes a dilemma the subjects face, how they feel, and why
- Sentence 3: Describes the impact of the current situation
1
Participant: Adam
I think the community needs a school with big spaces like a gym or an auditorium that can host extracurricular activities or be loaned to local community groups.
2
Participant: Kelsey
I am concerned about the school sitting vacant for a long period of time. I think that before we close the school we need a plan for what to do with these big spaces and figure out how they can be useful to the community.
Why does the community value large multi-purpose spaces?
Schools with large spaces support a wide variety of activities that are important to the community. Without access to these large multi-purpose spaces, communities lack flexible areas to discuss important issues or socialize. Therefore, people see schools as much more than a place to educate their children: they are an important anchor point that create meaningful connection for parents, volunteers and the community at large.
Theme:
Large multi-purpose spaces are valued by the community
- As you build each insight, make sure that it is:
- Definitive. Take a strong stance and make generalizations. Don’t pack your insights with nuances and details.
- Provocative. A good insight will prompt reactions. An insight that produces conflicting reactions amongst different people will be great fuel for Ideating.
- Complete. It should stand on its own, without you there to explain it.
- Repeat this across all other themes. Once you finish, step back and assess your work. By now you should have anywhere between 5 and 10 insights that you feel proud of. Look for duplicative insights or insights that may contradict each other. Contradiction is not necessarily bad, in fact, it may be indicative of how a situation is experienced by different people in different ways. Look for opportunities to generate new insights at the intersection of two related clusters.
Affinity Clustering, Themes and Insights May Help You:
- Turn lots of loose data into a few meaningful, provocative and statements you can act on.
- Challenge your own beliefs about the problem and about people’s behaviors.
- Think about new questions you may want to ask the people that you have engaged.
Risk of Not Doing This:
- You may fail to uncover the drivers behind human behavior.
- You may feel overwhelmed by the quantity of information and consequently avoid or miss critical connection and meaning.
- You may develop themes without being able to link to specific data points, which might make it more challenging to gain buy-in or understand the scale and impact of your theme.
What Comes Next?
- You can use Insights to challenge the problem statement, using the Reframing method found in this Sense Making module.
- Insights can help you shape questions as you get ready for future Listening activities.
- Insights are a powerful creative stimulus for the generation of ideas in the Ideating module.
Do's
- Comb through all of your research findings and be sure to capture your key data points on separate sticky notes. It is unrealistic to include all of your research findings in this analysis, so use your best judgment when determining which are most important or intriguing. Err on the side of including more, rather than less, because those that do not fall into a pattern will be eliminated anyway. One good rule of thumb is to include 8-12 notes from each person, place or event that you are capturing notes for, specifically 2-3 positives, 2-3 negatives, 2-3 opportunities, and 2-3 surprises.
- Group your findings based on similarities and patterns. For example, a note that says “60% of people use pre-written lists when grocery shopping” would likely be clustered with others around planning for trips to the grocery store, while notes that say “I only look at calories when I check the nutrition label” or “I am conscious of my sugar intake and purchase items without added sugars” might form another cluster.
Don'ts
- Do not settle on familiar or easy clusters. Remember that the objective of this exercise is to draw new meaning from your data points. Using themes like “people” and “process” will be less likely to reveal new perspectives.
- Do not base an entire insight on a single research finding—insights should come out of a larger pattern found in your research. If you feel as though you have such a powerful finding that it may provide the basis for an insight in itself, consider conducting additional research to validate it.
- Do not assume that your first round of clustering is sufficient. Usually the first set of clusters will not be as interesting as the second or third. Challenge yourself to look at your data points with new lenses and rearrange them.
Documentation Tips
Use the Themes and Insights worksheet provided with this toolkit as an initial repository of your emerging themes, showing their evolution into provocative and meaningful insights. Once you are satisfied with the insights, consider creating one slide for each insight, presenting the insight in big bold letters, with 2-3 notes, quotes and/or photos below to support it.
Empathy Map
Use the data you have captured to understand their thoughts, feelings, needs and desires from their perspective.
Overview
Empathy for other people who are part of the system you are trying to improve—whether a student, parent, teacher, or a CPS representative—is a fundamental mindset to ensure that any changes or improvements are made with consideration for everyone who has a stake in that system.
Empathy Maps help you question your own assumptions about other people and understand their experiences with the system in question by taking a human-centered approach to interpreting data that you have collected. They help you capture what you’ve seen or heard, question what you thought you knew, and start to build what you think you understand.
Exercise
As you go through your data, identify people or ideas that were particularly interesting, exciting, surprising, scary, or confusing. Choose one interesting person who stood out in an interview, observation or ideation session. This could be someone whose experience is representative of the experience of many people like them, someone whose experience with a common issue is much more felt than everyone else’s, or a person who offered a radically different idea to solve an issue that is affecting many people in their community.
Once you have identified that person, use the Empathy Map worksheet to help you make sense of your notes:
You should repeat this exercise with different stakeholders until you have enough to represent the experiences and perspectives of the different people with whom you have spoken. We recommend that you complete between 3-10 Empathy Maps to get a broad representation.
Empathy Maps May Help You:
- Turn lots of data points into a few, useful outputs.
- Find similarities and differences between the different people with whom you have interacted.
- Challenge your own assumptions about other people.
- Understand why a problem persists despite previous attempts to solve it.
- Uncover why people in a community seem to focus on one or a few specific issues.
Risk of Not Doing This:
- Create profiles of people that are based on assumptions or stereotypes rather than on their direct input.
- Treat challenges as “technical” or “financial” issues to be resolved mathematically, without consideration for the complex human experiences that are at stake.
- Make sweeping generalizations about people in a community without understanding the nuances of different people.
Recommended Inputs:
- If you are capturing Empathy Maps following activities from the Listening module, then your raw notes from Observations, Interviews or Group conversations will be a critical input.
- If you are capturing Empathy Maps following activities from the Ideating module, then the individual ideas provided by participants will be a critical input.
What Comes Next?
- If you completed activities from the Listening module before creating Empathy Maps, then you can use these as an input for Ideating.
- If you completed activities from the Ideating module before creating Empathy Maps, then you can use these as an input to define criteria for solutions in the Prototyping module.
Do's
- Combine your notes or ideas from 2 or 3 different people with very similar experiences and worldviews when completing one Empathy Map.
- Include evidence to support what you capture. This could take the form of quotes or observed behaviors from which you are drawing conclusions (e.g. “The person seemed disinterested about this topic as he/she was checking their phone while others were very engaged in conversation”).
- While completing your empathy maps, ask yourself: Do their behaviors align with their expressed thoughts, feelings, and beliefs? What motivates their actions? If you see any discrepancies between thoughts, words and actions, be sure to capture them. This doesn’t mean the person is necessarily lying. In fact, it may give you insight about an inner conflict they haven’t resolved.
- Compare Empathy Maps for different users to look for patterns and notable differences.
Don'ts
- Do not rely on a single Empathy Map for all of your insights. You should honor as many of the people with whom you have engaged when completing this exercise. As noted earlier, you should complete between 3 and 10 Empathy Maps to get a broad representation.
- Do not combine people into a single Empathy Map based on a single similarity. For example, creating an Empathy Map for “Latinx Moms” will miss the richness and nuances of each individual. A behavioral commonality like “Have early morning shifts at work” may be more insightful than a common demographic.
- Do not make ungrounded assumptions about what a person is feeling, thinking, or doing. While completing the empathy map, it is important to simply state what you heard or observed, not your opinions about it. In some cases you will need to use some intuition to draw conclusions; be sure to have valid evidence to support them and/or to note any statements in which you are filling the blanks with your own assumptions or interpretations.
Reframing
Use new inputs to refine the definition of the challenge or opportunity you are addressing
Overview
The initial Framing of a challenge or opportunity is usually vague, incomplete and/or loaded with assumptions. As you gather more input about the challenge or opportunity you are seeking to address, it is useful to go back to your original frame and determine whether it needs to be slightly edited or fully redefined.
Exercise
Use the Reframing worksheet to help you complete these steps:
- Write your original problem statement, which you likely completed in the Framing module.
- Summarize the main needs, barriers, and goals of your residents and other stakeholders. These should have emerged from work done in the Listening or Ideating modules.
- If you have completed an Affinity Clustering activity as part of this Sense Making module, select the two insights that best capture these needs, barriers, and goals. Otherwise, write these insights based on the needs, barriers and goals captured in step 2.
- Write a single, compelling problem statement that clearly describes what the problem is, who it is a problem for, and why it is a problem.
Reframing May Help You:
- Challenge your original understanding of the problem.
- Challenge how others understand the problem by succinctly communicating how the problem frame has evolved.
- Describe a common need in the community that remains unresolved.
- Create focus for Ideating.
Risk of Not Doing This:
The definition of the problem remains the same as it was at the beginning, despite new evidence and insight being available which may challenge that definition.
Recommended Inputs:
- The original problem statement created during the Framing module.
- Needs, barriers, and goals of your residents and other stakeholders from work done in the Listening module.
- Ideas generated through activities from the Ideating module.
- Insights identified during Affinity Clustering activity as part of this Sense Making.
Do's
- Ground the reframed problem statement on input from community members.
- Keep your reframed problem statement short and simple. Your goal is to capture a holistic definition and not all the details.
- Review and iterate the problem statement with other members of your team or stakeholders. Don’t assume that you will get it right the first time.
Don'ts
- Do not write reframed problem statements that are long and complicated, or that require someone to explain them. The reframed problem statement should speak for itself.
- Do not reframe the problem by yourself, as you run the risk of injecting your own biases or of making it too hard for others to understand.
Documentation Tips
Keep the different iterations of the reframed problem statement side by side and visible, whether on a project room wall or on a virtual whiteboard. This will help you and other stakeholders see how the understanding and the definition of the problem has evolved as new data is gathered and processed.