In FY2018, CPS experienced improved cash flow, which allowed the district to reduce its overall short-term borrowing to support liquidity and operations. CPS reduced its short-term borrowing in FY2018 by $455 million, declining from $1.55 billion in FY2017 to $1.09 billion in FY2018. By relying less on short-term borrowing, the district saved $68 million in short-term interest costs in FY2018 and created structural budgetary relief for future fiscal years. Additionally, CPS spent approximately three months of the year in a net positive cash position, which is an improvement from FY2017. CPS was able to achieve this decrease in borrowing due to historic statewide education funding reform, budgetary savings largely resulting from debt refinancing activities, improved cash flow forecasting, and active cash management.
CPS receives revenues at different times than when it pays expenses throughout the year. As a result, CPS’ cash flow goes through peaks and valleys throughout the year, depending on when revenues and expenditures are received and paid. Further, revenues are generally received later in the fiscal year while expenditures, mostly payroll, are level across the fiscal year, with the exception of debt service and pensions. The timing of these two large payments occurs just before major revenue receipts as well. The impact of these trends in revenues and expenditures causes cash flow pressures for the district.
In FY2018, $3.6 billion, or 70% of CPS’ revenues, were received after February, more than halfway into the fiscal year. The annual debt service payment is made in mid-February, just prior to the receipt of approximately $1.3 billion of the first installment of property tax revenues. The annual pension payment is made in late June, just before CPS receives approximately $1.1 billion of the second installment of property taxes (which are due August 1).
Historically, approximately 44% of the Board’s budgeted expenditures are for payroll and associated taxes, withholding, and employee contributions. These payments occur every other week, primarily during the school year from September through June. In addition, the Board’s recurring expenses for textbooks, educational materials, charter school payments, health care, transportation, facilities, and commodities total approximately 39% of the Board’s budgeted expenditures. The timing of these payments is relatively predictable and spread throughout the fiscal year.
Most organizations set aside reserves in order to weather these peaks and valleys in cash flow. Chicago Board of Education policy requires that the Board maintain an operating reserve of at least 5 percent of the total operating and debt service budget, and the Government Finance Officers Association (GFOA) recommends reserve levels between 5 and 15 percent of spending. Recent financial challenges have caused CPS to draw down on its reserves, but as of June 30, 2018, the district projects that fund balance will have returned to $315 million, which is near its own and GFOA’s policy target. As of June 30, 2018, CPS projects to have approximately $275 million of cash with $600 million in short-term borrowing outstanding.
Revenues
CPS has three main sources of operating revenues: local revenues, state revenues, and federal revenues.
Local Revenues:
Local revenues are largely made up of property taxes. CPS receives $2.8 billion of property taxes a year, of which $2.4 billion is received into the Board’s operating fund with the remaining $415 million pension levy being received directly by the Chicago Teachers’ Pension Fund. The Board’s operating property taxes are received in two installments, 96% of which are received from February onwards, over halfway through the fiscal year. The first installment of approximately $1.3 billion is due March 1, and is received in late February or March. The second installment of approximately $1.1 billion is typically received in July or August, depending on the due date. Property tax receipts have grown from $2,352.1 million in FY2012 to $2,808.7 million in FY2018, a compounded growth rate of 2.6%.
State Revenues:
State revenues are largely made up of Evidence Based Funding and state grants. Evidence Based Funding is expected to be received regularly from August through June in bi-monthly installments, as had been the case with General State Aid, the previous version of unrestricted state educational funding. In FY2018, Evidence Based Funding totaled approximately 74% of the state revenues received by CPS, up from 57% in FY2017. This increase improves cash flow because of the consistency of the payments. Block grant payments are not distributed regularly, and in FY2018, over 23% of all block grants were not distributed to CPS as of June 26, 2018. In FY2017, the delay of $467 million put significant pressure on cash flow, causing CPS to issue Grant Anticipation Notes (GANs) totaling $387 million — which were all repaid in by December 2017.
Federal Revenues:
Federal revenues can be received only once the grants are approved by the state, which administers block grants on behalf of the federal government. In two of the last three fiscal years, this approval has not occurred until about halfway into the fiscal year. In FY2018, all of the approximately $771 million of federal revenues will be received on or after December 2017.
Working Capital Short-Term Borrowing:
The district has the ability to issue short-term borrowing in order to address liquidity issues. Short-term borrowing allows the Board to borrow money to pay for expenditures when cash isn’t available and then repay the borrowing when revenues become available. State statute provides CPS with the ability to issue this type of cash flow borrowing through a Tax Anticipation Note (TANs). In FY2018, CPS issued a maximum of $1,094.7 million in TANs to support liquidity, a decrease of $455.3 million from FY2017. CPS achieved this decrease due to historic statewide education funding reform, budgetary savings, improved cash flow forecasting, and active cash management. These TANs are repaid from the operating property tax levy of the district. In FY2019, CPS plans to issue TANs of a similar size to support liquidity.
Short-term borrowing requires that CPS pay interest on these bonds. In FY2019, the Board has budgeted approximately $21 million in interest costs for the TANs. In FY2018, the Board budgeted $79 million in interest costs and $34 million in FY2017.
Expenditures
CPS expenditures are largely predictable, and the timing of these expenditures can be broken down into three categories: payroll and vendor, debt service, and pensions.
Payroll and Vendor:
On the expenditures side, approximately $3.1 billion of CPS’ expenditures is payroll and associated taxes, withholding, and employee contributions. These payments occur every other week, and most of the expenditures are paid from September through July. Approximately $1.7 billion of CPS vendor expenses are also relatively stable across the year.
Debt:
Debt service is deposited into debt service funds managed by independent bond trustees. These debt service deposits are backed by Evidence Based Funding and are deposited once a year. In FY2018, the debt service deposit from Evidence Based Funding was $323 million in mid-February. The timing of this debt service deposit comes just before CPS receives approximately $1.3 billion in property tax revenues. The remainder of the bonds are paid by personal property replacement taxes and/or property taxes and are deposited directly with the trustee and do not pass through the district’s operating fund from a cash perspective. The timing and amount of these payments are dictated by the bond documents. Once the trustees have verified that the debt service deposit is sufficient, they provide a certificate to the Board which then allows the Board to abate the backup property tax levy that supports the bonds.
Pensions:
CPS makes the bulk of the pension payment in late June. In FY2018, approximately $19 million of the pension payment was made throughout the year, and approximately $108 million was made on June 29, 2018, the last business day of the fiscal year. The timing of this pension payment comes just before CPS receives approximately $1.1 billion in property tax revenues. In FY2018, a reinstated dedicated pension levy directly intercepts $405 million in new revenue to the Chicago Teachers’ Pension Fund — these revenues do not pass through the district’s operating funds from a cash perspective. The dedicated pension levy plus the state funding for pensions included in last year’s education funding overhaul means that 83 percent of CPS’ pension obligation is currently funded by structural funding sources.
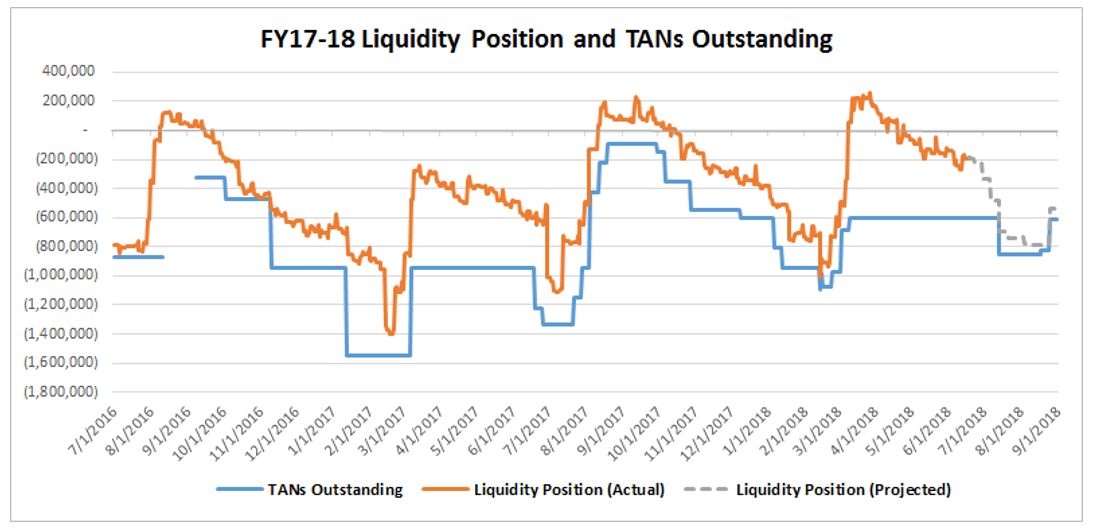
Forecasted Liquidity:
The chart below provides CPS’ liquidity profile in FY2017 and FY2018. As shown in the chart below, the district spent approximately three months in a net positive cash flow position in FY2018. As noted earlier, the total short-term borrowing was lowered by $455 million in FY2018, from $1.55B of maximum borrowing in FY2017 to $1.1B in FY2018. The maximum short-term borrowing in FY2018 in the June - August timeframe is currently projected to be $700 million, which is a $637M improvement from FY2017.