To build on the record-setting progress schools throughout Chicago have made, CPS is investing $3.1 billion in school-level funding in FY2019.
FY2019 is the sixth year that Chicago Public Schools has used Student Based Budgeting (SBB) to fund schools. SBB allocates funds to schools on a per-pupil basis, which creates greater consistency in funding across the district and ensures that funding is fair and equitable, as dollars follow the students.
For FY2019, CPS is increasing the SBB rate by 2.5 percent to support academic programming and higher teacher salaries. The base SBB rate for FY2019 is $4,397 per pupil, compared to $4,290 in FY2018.
In addition to the SBB rate, CPS is increasing funding for low-income students by 6 percent and creating a special fund to support schools that are experiencing sharp enrollment drops. Together, these investments will provide high quality instructional supports and resources to district schools.
Enrollment
CPS has had declining enrollment for many years. One of the reasons for this is due to the decline in birth rate – a trend not just affecting Chicago, but Illinois and the country as a whole. (See Appendix A for more information about enrollment and demographics.)
Budgets for the 2018-19 school year are based on each school’s 20th day enrollment during the 2017-18 school year. This represents a change from previous years’ methodology, when budgets were based on enrollment projections for the upcoming year and adjusted in the fall to account for actual enrollment.
Funding schools based on prior year enrollment will ensure schools will not see a budget reduction in the fall, even if enrollment declines. However, if a school’s enrollment next fall exceeds 20th day enrollment from fall of the 2017-18 school year, they will receive additional funding to support those additional students. This new model will allow schools to plan confidently for the year ahead and without concerns about a potential budget reduction in the fall. It will also provide school-based staff with greater certainty about their positions in the new year.
| School Type | FY2018 20th Day Enrollment | ||
|---|---|---|---|
| Pre-K | K-12 | Total | |
| Traditional District-Run Schools | 18,237 | 287,902 | 306,139 |
| Charter Schools | 215 | 57,186 | 57,401 |
| Contract Schools | 0 | 2,564 | 2,564 |
| District Specialty Schools | 989 | 1,037 | 2,026 |
| District Options Schools | 0 | 567 | 567 |
| ALOP/SAFE | 0 | 2,685 | 2,685 |
| Total District Enrollment | 19,441 | 351,941 | 371,382 |
Number of Schools
Per CPS definition, a school:
- is officially authorized by the Chicago Board of Education;
- is based in one or more buildings inside the geographic boundaries of the City of Chicago;
- has or will have one of the following governance structures: a local school council, an appointed local school council, a board of directors or a board of governors;
- employs at least one administrator to lead the school;
- employs at least one credentialed person to provide instruction to students;
- provides an appropriate curriculum for each grade level served that, at a minimum, meets all requirements of the Illinois State Code;
- requires progression towards a terminal grade level within a single school, regardless of physical location;
- is not defined under Illinois School Code as something other than a school (e.g., an Alternative Learning Opportunity Program is not a school); and
- has or is intended to have at least one actively enrolled student during the school year.
Based on this definition, there are 644 schools in FY2019, compared to 646 schools in FY2018. Table 2 gives the school count by school type.
| School Type | Description | FY2018 | FY2019 |
|---|---|---|---|
| Traditional district schools | District-run schools funded through Student Based Budgeting | 500 | 499 |
| Charter schools | Public schools managed by independent operators and certified under state charter law | 122 | 121 |
| Contract schools | Public schools managed by independent operators under a contract with the district | 9 | 9 |
| District specialty schools | District-run schools that primarily serve students with significant diverse learning needs or early childhood students. | 10 | 10 |
| District options schools | District-run high schools for students in restricted environments or students who need educational alternatives to traditional high schools | 4 | 4 |
| SAFE school programs | Schools managed by independent operators for students who have been expelled from other schools due to violence | 1 | 1 |
| Total schools | 646 | 644 | |
| Not counted as schools: | |||
| ALOP programs | Programs managed by independent operators that provide educational options for students who have dropped out of school and seek to return | 10 | 10 |
The following table explains the change in school count between FY2018 and FY2019.
| School Short Name | Description | Change |
|---|---|---|
| Traditional District Schools | ||
| BRONZEVILLE CLASSICAL | New school | 1 |
| SOR JUANA INES DE LA CRUZ | New school | 1 |
| JENNER | Consolidated by board action | -1 |
| CASTELLANOS | Consolidated by board action | -1 |
| ROBESON HS | Closed by board action | -1 |
| Net Change in Traditional District Schools | -1 | |
| Charter Schools | ||
| ACE TECH HS | Closed by board action | -1 |
| Net Change in Charter Schools | -1 | |
| District Options Schools | Net Change in District Options Schools | 0 |
| ALOP Programs | Net Change in ALOP Programs | 0 |
| SAFE Schools | Net Change in SAFE Schools | 0 |
School Budget Overview
The FY2019 budget contains more than $3.7 billion budgeted at school units, including over $2.2 billion budgeted for core instruction at 644 schools. The following tables show fund and position allocations by school type and funding category:
| School Type | Core Instruction | Supp. Diverse Learners | Bilingual | Early Childhood | Other Programs | Discretionary | Operations | Total |
|---|---|---|---|---|---|---|---|---|
| District Elementary | $1,150,031 | $413,274 | $20,389 | $141,163 | $61,302 | $280,410 | $100,163 | $2,166,731 |
| District High Schools | $444,757 | $128,068 | $3,627 | $183 | $35,442 | $85,213 | $38,359 | $735,649 |
| Contract | $15,398 | $4,020 | - | - | $88 | $3,402 | $6,721 | $29,628 |
| ALOP | $16,885 | $2,207 | - | - | $91 | $3,937 | $7,598 | $30,718 |
| Specialty | $8,551 | $29,282 | $491 | $7,579 | $93 | $1,737 | $1,302 | $49,035 |
| District Options | $6,034 | $3,504 | - | - | $10,140 | $765 | $239 | $20,683 |
| SAFE | $641 | $165 | - | - | $0 | $27 | $292 | $1,125 |
| Subtotal | $1,642,296 | $580,519 | $24,507 | $148,925 | $107,156 | $375,490 | $154,675 | $3,033,569 |
| Charters | $621,043 | $18,271 | - | - | $2,037 | $35,412 | $3,296 | $680,058 |
| Total | $2,263,339 | $598,790 | $24,507 | $148,925 | $109,193 | $410,902 | $157,971 | $3,713,627 |
| School Type | Core Instruction | Supp. Diverse Learners | Bilingual | Early Childhood | Other Programs | Discretionary | Operations | Total |
|---|---|---|---|---|---|---|---|---|
| District Elementary | 10,139.5 | 5,312.0 | 173.0 | 1,763.7 | 552.5 | 2,545.2 | 2,433.0 | 22,918.9 |
| District High Schools | 4,058.0 | 1,473.5 | 32.0 | 2.0 | 314.6 | 837.6 | 839.0 | 7,556.7 |
| Charter/ Contract | - | - | - | - | - | - | 121.0 | 121.0 |
| ALOP | 0.0 | 0.0 | 0.0 | 0.0 | 0.0 | 0.0 | 0.0 | 0.0 |
| Specialty | 67.0 | 408.5 | 5.0 | 89.0 | 2.0 | 4.0 | 27.0 | 602.5 |
| District Options | 50.0 | 31.4 | - | - | 78.5 | 2.0 | 6.0 | 167.9 |
| SAFE | 0.0 | 0.0 | 0.0 | 0.0 | 0.0 | 0.0 | 0.0 | 0.0 |
| Total | 14,314.5 | 7,225.4 | 210.0 | 1,854.7 | 947.6 | 3,388.8 | 3,426.0 | 31,367.0 |
The following sections discuss Funding for Core Instruction and Additional Funding Received by Schools, including funding for diverse learners, bilingual, early childhood, other programs, discretionary funds, and operations.
Funding For Core Instruction
Traditional District Schools
Traditional district schools are funded through SBB. The only district-run schools that do not fall in this category are the ten specialty schools and four district options schools, which are discussed in later sections.
In addition to increasing the SBB rate for all schools, CPS has allocated an additional $14 million for district-run schools with low enrollment and another $5 million for district-run schools that would have otherwise seen an SBB funding reduction of more than 3 percent this year. This supplemental funding is being provided to help ensure all schools, and especially those that serve at-risk students, are able to offer high quality academics in the 2018-19 school year.
In the aggregate, SBB funding for district-run schools is increasing by more than $52 million from 20th day of FY2018.
| Traditional District Schools | FY2018 20th Day | FY2019 Budgeted | Change | % Change |
|---|---|---|---|---|
| Number of schools | 501 | 500 | -1 | -0.2% |
| Number of K-12 students | 287,902 | 288,403* | 501 | 0.2% |
| SBB funding, in millions | $1,304 | $1,356 | $52 | 4.0% |
*Although school budgeting for FY19 is based on 20th Day enrollment from FY2018, a small number of schools are budgeted at higher enrollment counts if their school's enrollment is expected to increase as a result of a district initiative.
| Category | Job Title | FY2018 Budget | FY2019 Budget |
|---|---|---|---|
| TEACHERS | Teachers | 10,743.9 | 10,901.8 |
| Assistant Principals | 462.5 | 470.3 | |
| School Counselors / Social Workers / Nurse | 127.4 | 143.3 | |
| Coaches / Instructional Leaders / Other Teachers | 80.8 | 26.1 | |
| EDUCATION SUPPORT PERSONNEL | Teacher Assistants | 349.9 | 187.3 |
| School Clerks | 100.8 | 107.3 | |
| Instructor Assistants | 47.9 | 22.5 | |
| School Security Officers | 66.6 | 111.1 | |
| School Clerk Assistants | 47.7 | 61.8 | |
| Technology Coordinators | 46.4 | 58.8 | |
| Guidance Counselor Assistants | 45.6 | 50.0 | |
| Other Education Support Personnel | 314.1 | 324.9 | |
| TOTAL | 12,433.6 | 12,465.2 |
Note: In FY2018, funding for special education teachers and support assistants was provided through SBB. In FY2019, these personnel costs are funded centrally. Additional positions may be funded above centrally-provided allocations at principal discretion. For comparison’s sake, the above table excludes 2,687.0 special education teachers and 1,866.3 special education support assistants funded by SBB in FY2018, and 40.5 special education teachers and 20.7 special education support assistants funded by SBB in FY2019, because including those figures would not provide for an apples-to-apples comparison.
Contract Schools
Contract schools are public schools managed by independent operators. First established in Chicago in 1997, they offer an alternative to traditional district-managed schools. Contract schools have similar autonomies as charter schools with regard to budget and curricular operations.
As outlined in Chart 1, CPS provides tuition to contract schools in two components: SBB and non-SBB. Together, these tuition amounts provide contract schools with an equitable share of the district’s general funds budget.
Chart 1: Overview of CPS Operating Budget for Contract Funding
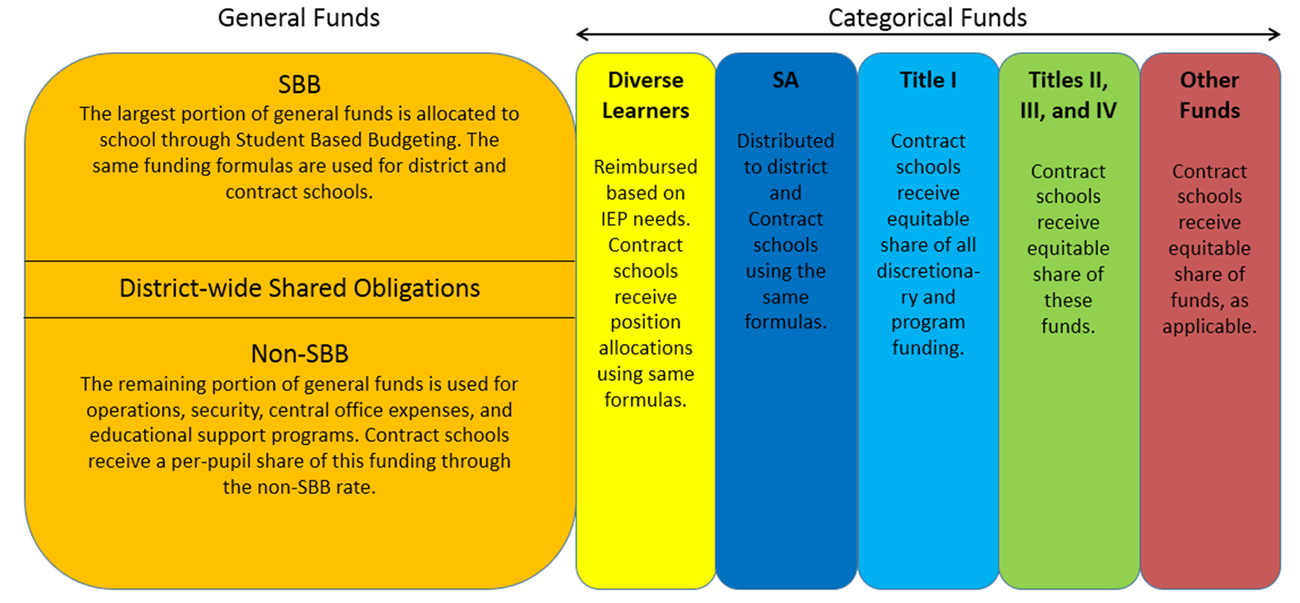
SBB is the largest portion of the general funds budget, and it is allocated to district and contract schools and Alternative Learning Opportunity Programs (ALOP) under the SBB model. The general funds budget also includes some funding categories that are considered district-wide shared obligations, such as the unfunded pension liability. Contract schools do not receive tuition funding based on these shared obligations. Funding for operations, security, central office expenses and education support programs are paid to contract schools through a second category of funding called “non-SBB” funding, rather than through citywide spending for district-run schools. This ensures that contract schools receive an equitable share of centralized spending and of each categorical funding source, where applicable. Finally, administrative fees are charged to contract schools so that they contribute equitably to district overhead costs. For more details on how contract schools will be funded in FY2019, please see Appendix B.
The base rate for non-SBB funding has increased from $1,750 in FY2018 to $2,004 in FY2019.
| Contract Schools | FY2018 20th Day | FY2019 Projected | Change | % Change |
|---|---|---|---|---|
| Number of schools | 9 | 9 | 0 | 0.0% |
| Number of K-12 students | 2,564 | 2,484 | -80 | -3.1% |
| SBB funding, in millions | $14.8 | $14.4 | -$0.4 | -2.7% |
| Non-SBB funding, in millions | $5.3 | $5.9 | $0.6 | 11.3% |
| Administrative fees (estimated), in millions | -$0.6 | -$0.6 | $0.0 | 0.0% |
| Total general education tuition payments, in millions | $19.5 | $19.7 | $0.2 | 1.0% |
Alternative Learning Opportunity Programs (ALOP)
Alternative Learning Opportunity Programs provide different educational options for at-risk youth who are not currently enrolled in school. Since 2011, CPS has expanded partnerships with providers that specialize in working with off-track youth and has more than doubled the number of available seats in options schools and programs.
Two ALOP programs were voluntarily closed by their providers in FY2018, bringing the total to 10. Twenty-eight charter and contract schools and three district-run schools serve the same population of at-risk youth who have dropped out of school and seek to return.
| ALOP Programs | FY2018 20th Day | FY2019 Projected | Change | % Change |
|---|---|---|---|---|
| Number of programs | 10 | 10 | 0 | 0.0% |
| Number of K-12 students | 2,684 | 2,602 | -82 | -3.1% |
| SBB funding, in millions | $16.3 | $15.9 | -$0.4 | -2.5% |
| Non-SBB funding, in millions | $5.8 | $6.4 | $0.6 | 10.3% |
| Administrative fees (estimated), in millions | -$0.7 | -$0.7 | $0.0 | 0% |
| Total general education tuition payments, in millions | $21.4 | $21.6 | $0.2 | 0.9% |
Specialty Schools
Seven specialty schools primarily serve students with significant diverse learning needs, and three early childhood centers serve only Pre-K students. Specialty schools include:
- Three early childhood centers serving only Pre-K students (Vick, Thomas, Stock)
- Three early childhood centers serving Pre-K students, but have a significant number of diverse learners enrolled in primary grades (Blair, Beard, Rudolph)
- Four high schools serving 100 percent diverse learners (Northside Learning, Southside, Graham, and Vaughn).
In FY2019, specialty schools will receive $8.5 million in funding for core instruction, which represents 17.4 percent of their total budget of $49 million. The remainder of specialty schools’ budgets is for pre-K and diverse learner programming specific to each school. This funding is provided by the Department of Early Childhood Education or the Office of Diverse Learner Support Services. The costs of these schools are significantly higher than traditional schools when compared on a per-pupil basis, to account for the specific needs of the diverse learners they serve.
District Options Schools
District options schools serve students in confinement, at risk of dropping out of school, or who have dropped out and wish to return. District options schools include one school located at the Cook County Jail (York), one at the Cook County Juvenile Temporary Detention Center (Jefferson), one school that serves pregnant women (Simpson), and one school that serves returning dropouts and students at risk of dropping out (Peace & Education Coalition).
In FY2019, district options schools received a core allocation of $6.0 million for teachers and administrative positions. In addition, they received $10.1 million in supplemental Title I positions, which will help the schools address their unique challenges.
SAFE Schools
SAFE schools provide an educational option to students who have been expelled from another CPS school due to violence. CPS has one SAFE school, which is managed by an independent operator. The SBB and non-SBB tuition cost for this SAFE school is $0.9 million, which is partially offset by a state Regional Safe Schools grant.
Additional Funding Received By Schools
Although funding for core instruction is typically the largest portion of a school’s budget, schools receive additional funding to meet specific student needs, including funding for diverse learners, bilingual students, early childhood students, other programs, and school operations. See Appendix B for information on funding formulas for these allocations.
Diverse Learner Funding
In FY2019, schools received an allocation of centrally-funded special education teachers and paraprofessionals to serve diverse learners outside of cluster programs. This is a change from FY2018, when schools received a dollar allocation for special education positions that was combined with their SBB funds.
FY2019 allocations are based on the number of special education teachers and paraprofessionals needed to meet the IEP needs of students at the school (excluding students in cluster programs), as determined by a school-by-school review. Additionally, FY2019 allocations were determined from each schools’ special education student population in April. Schools received both special education teacher and paraprofessional allocations based on the student population and the IEP needs within that student population.
Bilingual Education
Schools receive supplemental bilingual education teachers and per-pupil funds based on their number of English language learner (EL) students. There are two programs: Transitional Bilingual Education (TBE), for schools that have 20 or more EL students of the same language background, and Transitional Program of Instruction (TPI), for schools that have fewer than 20 EL students of the same language background. The Office of Language and Cultural Education (OLCE) tracks EL students and allocates supplemental bilingual teachers and funds to schools.
The FY2019 budget contains $24.5 million in supplemental funding to schools, including 211 supplemental bilingual education teachers and coaches. Bilingual education is supported by local funding and dedicated state and federal funding.
Early Childhood
The FY2019 budget contains $254 million in funding for early childhood programs at 356 elementary schools. This amount includes $2.6 million of Title I funding that is used to fund some of the costs of 19 child-parent centers, and $2.8 million for tuition- based Pre-K programs at district-run schools.
Early childhood programs serve Pre-K students, usually ages 3 and 4, and are funded from both a state grant (Pre-School for All) and federal Head Start funds. CPS also provides funding to community-based providers for early childhood programs, as described more fully in the Early Childhood department narrative, but this funding is not reflected in school budgets.
To better meet family needs and ensure children are getting services that will set the foundation for long-term success, CPS has expanded its investment in Early Childhood education in FY2019 and will provide an additional 185 full-day preschool classrooms in high-need communities. The expansion of full-day pre-kindergarten is the first step in Mayor Rahm Emanuel’s four-year plan to provide all four-year-olds in Chicago with access to tuition-free early childhood education.
Other Programs
Some schools receive teaching positions or other additional funding for specific programs that are run at those schools. All programs except for STEM are funded from general funds. Details on these programs are found in their respective departmental narratives. Significant programs are included in the following table.
|
Positions (FTEs)
|
Budget ($ millions)
|
|||||
|---|---|---|---|---|---|---|
| FY2018 Budget | FY2019 Budget | Change | FY2018 Budget | FY2019 Budget | Change | |
| Magnet Schools | 151.4 | 152.4 | 1.0 | $17.4 | $18.0 | $0.6 |
| JROTC | 139.0 | 139.0 | 0.0 | $14.5 | $15.5 | $1.0 |
| International Baccalaureate | 117.5 | 126.5 | 9.0 | $13.3 | $14.6 | $1.3 |
| Magnet Cluster Programs | 100.0 | 100.0 | 0.0 | $11.3 | $11.8 | $0.5 |
| STEM* | 41.0 | 50.0 | 9.0 | $4.6 | $5.8 | $1.2 |
| Selective Enrollment HS | 35.0 | 35.0 | 0.0 | $4.3 | $4.5 | $0.2 |
| Montessori Programs | 54.0 | 54.0 | 0.0 | $3.8 | $4.0 | $0.2 |
| Critical Language Initiative | 30.0 | 30.0 | 0.0 | $3.0 | $3.2 | $0.2 |
| Regional Gifted Centers | 20.8 | 20.0 | -0.8 | $2.3 | $2.4 | $0.1 |
| Classical Schools | 14.7 | 19.0 | 4.3 | $1.6 | $1.9 | $0.3 |
| Regional Gifted Centers ELL | 7.0 | 7.0 | 0.0 | $0.8 | $0.9 | $0.1 |
| International Gifted | 2.0 | 2.0 | 0.0 | $0.3 | $0.3 | $0.0 |
| Academic Centers | 1.0 | 1.0 | 0.0 | $0.1 | $0.1 | $0.0 |
| Totals | 713.4 | 735.9 | 22.5 | $77.2 | $82.8 | $5.6 |
*Includes grant funding.
Discretionary Fund
CPS is providing schools with an additional $14 million for low income students in FY2019 by raising the rate for Supplemental Aid (formerly Supplemental General State Aid) from $857 per student to $910 per student. Research has shown that students from low-income households generally require additional resources to be successful, and the increase in funding for these students will help ensure all of our students have the support they need to reach their potential.
Supplemental Aid replaced Supplemental General State Aid (SGSA) in FY2019 for eligible pre-K-12 students. Based on changes to state funding laws, SGSA is no longer a separate stream of funding, but it is included in the overall allocation of state funding the district receives under the new Evidence-Based Funding (EBF) formula. As such, any remaining funds that schools have from their FY2018 allocation of SGSA will be carried over into FY2019, but FY2019 will be the last year that this practice will take place. A preliminary carryover will be distributed before school starts in fall 2018, and the final carryover amount will likely be distributed sometime after October 2018.
Moving forward and as part of the FY2019 budget, district and contract schools will receive Supplemental Aid (SA) funding that follows the same spending rules as local funds, allows greater flexibility in how funds are used, and expires annually at the end of the fiscal year. Funds are distributed to the schools in proportion to the number of enrolled pupils who are eligible to receive free or reduced-price meals, under the federal Child Nutrition Act of 1966 and the National School Lunch Act, as of the 20th day of the school year.
A total of $230 million in Supplemental Aid funding will be provided to schools as part of the FY2019 budget.
Title I of the Federal Every Student Succeeds Act (ESSA) provides funds to schools with high concentrations of low-income, educationally disadvantaged students who require supplementary services. Approximately 87 percent of CPS schools qualify for Title I discretionary funding. The FY2019 budget contains $184 million in Title I discretionary funding for CPS schools.
Non-Education Expenses
Schools have received additional positions, services and funding for various operational expenses. In FY2019, the following non-education funding appears in schools budgets:
- Security: School security officers and security aides are assigned to schools by the Office of Safety and Security. Security positions are budgeted at schools.
- Food Service: This includes the labor costs of the lunchroom staff; the food costs required to provide lunch and breakfast are budgeted centrally.
Other operational expenses are managed centrally, rather than in schools, to gain district-wide efficiency and savings. Among the positions managed centrally are bus aides, engineers and custodians. Please refer to the department narratives for more details about each of these operational areas.
Private Schools
Students, teachers and parents of private/nonpublic schools are entitled to federal support through Every Student Succeeds Act (ESSA) (Title I, Title II, Title III, Title IV) and the Individuals with Disabilities Education Act (IDEA). CPS must set aside a share of the federal funds it receives to make services available to eligible private/nonpublic school students, teachers and parents. However, these funds are not paid directly to the private schools; instead, CPS operates these programs on behalf of eligible students, teachers and parents.
Each year, CPS oversees and manages services for approximately 60,000 students in 240 private schools, totaling almost $30 million. In addition, we oversee services for children who attend five residential sites that specialize in serving children under the guardianship of the Illinois Department of Children and Family Services.
The following table shows the allocations for each of the federal programs. Funding is proportionate to the number of eligible students in each private school compared to the student’s designated CPS neighborhood school. FY2019 amounts are projections; the final amounts will be determined after the district’s FY2019 application is approved by the Illinois State Board of Education. The decline in these funding sources for private school programs is due to an overall decline in the district’s federal revenue.
| Federal Program | FY2017 Budget | FY2018 Budget | FY2019 Budget |
|---|---|---|---|
| Title I (Improving Academic Achievement of Disadvantaged Students) | $18,067,351 | $19,078,805 | $18,999,805 |
| Title IIA (Improving Teacher Quality) | $1,279,425 | $3,308,326 | $2,942,957 |
| Title III (English Language Learners) | $291,746 | $330,016 | $351,658 |
| Title IVA | $0 | $0 | $519,658 |
| Individual Disabilities Education Act (IDEA) | $3,735,391 | $3,654,898 | $2,171,830 |
| Title I, Part D (Neglected) | $559,690 | $544,359 | $507,839 |
| Total | $23,933,603 | $26,916,404 | $25,493,747 |
Networks
District-run schools are organized into networks, which provide administrative support, strategic direction, and leadership development to the schools within the network.
Networks are led by network chiefs, who are responsible for building effective schools with strong leaders by developing a professional development plan, collecting and assessing data to drive interventions, supporting schools in the development and implementation of their Continuous Improvement Work Plan, collaborating on best practices with other networks and enhancing community and parental involvement. Networks are supported by deputy chiefs, data strategists, instructional support leaders, and administrative support. Each network also has a Social Emotional Learning Specialist and a Specialized Services Administrator, although these positions appear in the budgets for Office of College and Careers and the Office of Diverse Learners, respectively. All network chiefs and their offices report to the Office of Network Support. HS networks will also have a designated Network Operations manager, data strategist and shared executive assistant.
For the 2018-19 school year, CPS will be moving from a 13-network structure to a 17-network structure, which will be organized by geographic region and grade level. The four new networks will serve only high schools, allowing them to specialize in the unique needs of high schools and support the unique instructional needs of high schools and ensure all networks are able to better facilitate high quality instruction. The 13 existing networks will retain their elementary schools, while the four new networks will support the city’s high schools. In addition to the networks, schools may be managed as an Independent School (ISP) or by the Academy for Urban School Leadership (AUSL). ISP and AUSL schools do not belong to any of the 17 geographic networks.
| Network | City Planning Zones |
|---|---|
| 1 | Sauganash, Reed-Dunning, Albany Irving |
| 2 | Ravenswood |
| 3 | Austin, Belmont-Cragin |
| 4 | Logan, Lincoln Park |
| 5 | Humboldt Park, Garfield, West Humboldt, North Lawndale |
| 6 | Near North, Near West, Loop, Bridgeport, Chinatown |
| 7 | Pilsen, Little Village |
| 8 | McKinley Park |
| 9 | Bronzeville, Hyde Park, Woodlawn |
| 10 | Beverly, Midway, Chicago Lawn, Ashburn |
| 11 | Englewood, Auburn-Gresham |
| 12 | Chatham, South Shore |
| 13 | Far South, Far East |
| 14 | New High School Network 1 |
| 15 | New High School Network 2 |
| 16 | New High School Network 3 |
| 17 | New High School Network 4 |
| AUSL | |
| ISP |
In FY2019, consistent with prior years, each network will receive a $55,000 non-personnel budget for administrative expenses and professional development.
Personnel dollars were distributed among the 13 elementary networks based on need. Each network will receive a foundation allocation, but additional dollars will be given to networks with higher poverty levels and/or higher concentrations of low-performing schools. Each of the high school networks will receive a chief, operations manager, data strategist, and part-time administrative assistant.
| Network | Personnel | Non-Personnel | FY2019 Budget |
|---|---|---|---|
| 1 | $1,405,460 | $55,000 | $1,460,460 |
| 2 | $1,297,875 | $55,000 | $1,352,875 |
| 3 | $1,607,921 | $55,000 | $1,662,921 |
| 4 | $1,225,549 | $55,000 | $1,280,549 |
| 5 | $1,410,300 | $55,000 | $1,465,300 |
| 6 | $1,444,619 | $55,000 | $1,499,619 |
| 7 | $1,244,701 | $55,000 | $1,299,701 |
| 8 | $1,506,546 | $55,000 | $1,561,546 |
| 9 | $1,426,371 | $55,000 | $1,481,371 |
| 10 | $1,234,934 | $55,000 | $1,289,934 |
| 11 | $1,701,333 | $55,000 | $1,756,333 |
| 12 | $1,286,234 | $55,000 | $1,341,234 |
| 13 | $1,578,178 | $55,000 | $1,633,178 |
| 14 | $511,483 | $55,000 | $566,483 |
| 15 | $511,483 | $55,000 | $566,483 |
| 16 | $511,483 | $55,000 | $566,483 |
| 17 | $511,483 | $55,000 | $566,483 |
| Total | $20,415,953 | $880,000 | $21,350,953 |
Aside from the addition of Networks 14-17, the only other addition to geographic network budgets was 39 grant-funded Early Childhood positions, transferred from the Early Childhood department to allow staff to work more closely with their respective networks. Non-personnel costs are funded through general education funds, while positions are funded through general education, Title I and Title II funds.
| Network Budgets | FY2017 | FY2018 | FY2019 |
|---|---|---|---|
| Regular positions | $14.2 | $14.3 | $20.4 |
| Hourly/overtime salary and non-personnel | $0.8 | $0.7 | $0.9 |
| Total | $15.0 | $15.0 | $21.3 |