CPS’ Capital Improvement Program, described in the Capital chapter, funds investments such as school additions and renovations, playgrounds, air conditioning, WiFi networks, and technology devices. The Capital Improvement Program also funds core investments in facilities, such as repairing or replacing infrastructure and mechanical systems. These investments create high-quality learning environments in schools throughout Chicago to support a world-class education for our students.
CPS funds its Capital Improvement Program largely through the issuance of bonds. Bonds are debt instruments that are similar to a loan, requiring annual principal and interest payments. In FY2018, due to advocacy from parents, educators and courageous elected officials from Chicago and throughout the state, the State of Illinois approved Public Act 100-465 (PA 100-465). This created a new funding formula for school districts throughout the State, including CPS. The new Evidence-Based Funding formula (EBF or EBF Formula) replaces the prior General State Aid (GSA) formula. As a result of PA 100-465 and the EBF Formula, most of the outstanding CPS bonds that were previously repaid from GSA revenues will now be paid by EBF revenues going forward.
The EBF formula provides more funding stability for the Board’s fixed costs, including capital, but it is also a major revenue source for core academic priorities. Therefore, CPS can more effectively balance day-to-day classroom needs with the need for quality education facilities. To continue to improve school facilities and lessen the impact of future debt service repaid from the district’s operating budget, CPS will use the statutorily-authorized annual Capital Improvement Tax (CIT) levy that the Board approved in FY2016 to aid in funding its ongoing Capital Improvement Program. In FY2017, the Board issued its first series of Capital Improvement Tax bonds (CIT Bonds), and a subsequent second series of CIT Bonds was issued in FY2018. The CIT Bonds are further described below.
Debt Overview
As of June 30, 2018, the Board of Education has approximately $8.2 billion of outstanding long-term debt and $600 million of outstanding short-term debt. FY2019 includes appropriations of $607 million for alternate bonds, capital improvement tax bonds, and Public Building Commission payments.
Types of Obligations
The Board is authorized by state law to issue notes and bonds and to enter into lease agreements for capital improvement projects.
As with most school districts, CPS issues bonds backed by the full faith and credit of the Board, otherwise known as General Obligation (GO) Bonds. These GO bonds are paid for from all legally available revenues of the Board.
CPS also issues a special type of GO bond called an “Alternate Revenue” GO Bond. These bonds are backed by two revenue sources and offer a number of other bondholder protections.
The first revenue source that is supporting CPS bonds is one of the following: EBF, Personal Property Replacement Taxes (PPRT), revenues derived from intergovernmental agreements with the City of Chicago, property taxes, and federal interest subsidies. The majority of CPS bonds are backed by EBF. In FY2019, approximately $328 million in EBF revenues will be required for debt service, compared to $367 million in FY2018 and $373 million in FY2017. In addition to debt service funded by EBF, $35 million of debt service will be paid from PPRT in FY2019. Debt service paid from PPRT revenues also reduces PPRT revenues available for operating purposes. Additionally, $113 million in debt service will be paid by revenue resulting from Intergovernmental Agreements with the City of Chicago.
The second revenue source for all CPS Alternate Revenue GO Bonds is a property tax levy which is available to support debt service should the first pledge of revenue not be available. On an annual basis, when the first source of revenue is available to pay debt service, the property tax levy can be abated and not extended, as it has been every year.
The Board is authorized to issue Alternate Revenue Bonds after adopting a resolution and satisfying public notice publication and petition period requirements in lieu of a voter referendum, which is typical in other school districts. The bonds are also supported by the General Obligation pledge of the Board to use all legally available revenues to pay debt service.
The Public Building Commission (PBC), a local government entity which manages construction of schools and other public buildings, has in the past sold bonds which rely on CPS property tax levies. No PBC bonds have been issued since 1999, and these bonds expire in 2020. The FY2019 budget includes $52 million in payments for principal and interest on these bonds.
CPS has benefitted from issuing bonds with federal interest subsidies, resulting in a very low cost of borrowing. These include Qualified Zone Academy Bonds (QZABs), which provide capital funding for schools in high poverty areas, Qualified School Construction Bonds (QSCBs), and Build America Bonds (BABs), the latter two created by the American Recovery and Reinvestment Act of 2009 (ARRA). With the expiration of ARRA, new QSCBs and BABs are no longer available, although the federal government continues to pay the interest subsidy to CPS. The FY2019 budget includes $25 million of federal subsidies for debt service.
In FY2016, CPS began levying a Capital Improvement Tax levy to fund capital projects. After the CIT was authorized by the City Council, it generated $45 million in its initial year. In FY2017, CPS sold the first series of dedicated revenue CIT bonds to fund capital projects for $730 million. In FY2018, CPS sold a second series of CIT bonds for $65 million.
In FY2019, the budget includes a CIT levy of $56 million and appropriations of approximately $47 million to pay debt service on these CIT bonds. The CIT bonds are not Alternate Revenue GO bonds. The bonds are limited obligations of the Board payable solely from the CIT levy. As a result of the structure, the CIT bonds received a single “A” bond rating at the initial issuance and have currently been able to maintain this rating, allowing CPS to achieve a lower borrowing cost.
Debt Management Tools and Portfolio Mix
As part of the Debt Management Policy, CPS is authorized to use a number of tools to manage its debt portfolio including refunding of existing debt, issuing fixed or variable-rate bonds, and issuing short-term or long-term debt. These tools are used to manage various types of risks, to generate cost savings, to address interim cash flow needs, and to assist capital asset planning.
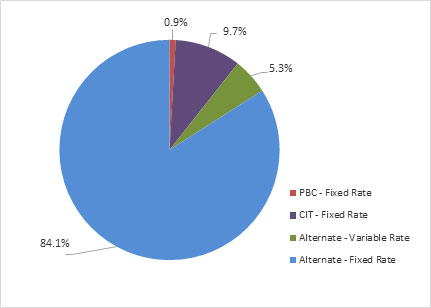
Typically, CPS issues long-term fixed-rate bonds, which pay a set agreed upon interest rate according to a schedule established at the time of debt issuance. However, CPS has also originally issued long-term bonds with a variable rate structure where by the interest rates in a short-term mode are established pursuant to a margin over an index for a predetermined amount of time. Beginning in 2016, several variable rate structures began to experience the expirations of their initial periods. CPS elected not to re-offer or refinance some of these bonds at the time, and as a result, the interest rate increased to a fixed rate. During FY2018, as market conditions and timing permitted, CPS engaged in multiple refunding transactions on these bonds and refinanced the debt into long-term fixed rate bonds. As a result of these transactions, as of June 30, 2018, only 5.3% of the outstanding CPS long-term debt is variable rate, and there are no expirations of their initial periods with these issues.
Chart 1: Summary of Long-Term Fixed Rate and Variable Rate Debt
(as of June 30, 2018)
Credit Ratings
Credit rating agencies are independent entities and their purpose is to give investors or bondholders an indication of the creditworthiness of a government entity. A high credit score can lower the cost of debt issuance, much the same way a strong personal credit score can reduce the interest costs of loans and credit cards. Ratings consist of a letter “grade,” such as A, BBB, BB, or B, and a credit “outlook”, or expectation of the direction of the letter grade. Thus, a “negative outlook” anticipates a downgrade to a lower letter grade, a “stable outlook” means the rating is expected to remain the same, and a “positive outlook” may signal an upgrade to a higher, better rating.
As a result of education funding reform, all rating agencies revised their long-term GO bond rating outlooks on CPS from negative to stable or positive during FY2018. All rating agencies continue to express concern about a less than optimal liquidity position and the accumulated general operating fund deficit as a result of years of structurally imbalanced operations that occurred because of the state’s education funding formula, which was then the least equitable in the country. However, because education funding reform provided the new EBF Formula, an increase in the required State contribution to CPS teachers’ pensions, and the ability for CPS to collect a pension property tax levy, CPS is on much stronger financial footing.
CPS meets frequently with the credit rating agencies about its budget, audited financial results, debt plan, and management initiatives to ensure the agencies have the most updated information possible. The rating agencies take several factors into account in determining any rating, including management, debt profile, financial results, liquidity, and economic and demographic factors.
CPS’ current general obligation credit ratings from Standard and Poor’s, Fitch Ratings, and Moody’s Investor Service are B Positive, BB- Stable and B3 Stable, respectively. Kroll Bond Rating Agency (added in FY2015) currently rates the CPS Series 2016AB and Series 2017BCDEFG&H general obligation bonds BBB Positive, and all other CPS general obligation bonds BBB- Positive.
In addition to the CPS general obligation bond rating, the CIT bonds – which were first issued in FY2017 as a new and separate credit structure from the existing CPS general obligation credit – contain a separate and distinct credit rating. The CIT credit structure received an investment grade rating from two rating agencies in FY2017. Fitch Ratings rated the CIT credit “A” and Kroll Bond Rating Agency rated the CIT credit “BBB”.
FY2019 Liquidity and Short-Term Borrowing
As a result of education funding reform, the district has dramatically improved its cash position and reduced its short-term borrowing. Please see further discussion in the Cash Management chapter. CPS reduced its short-term borrowing in FY2018 by $455 million, declining from $1.55 billion in FY2017 to $1.09 billion in FY2018. By relying less on short-term borrowing, the district saved $68 million in short-term interest costs in FY2018 and created structural budgetary relief for future fiscal years. Additionally, CPS spent approximately three months of the year in a net positive cash position, which is an improvement from FY2017.
CPS will continue to issue Tax Anticipation Notes (TANs) in Fiscal Year 2019 to cover operating cash flow needs, which are repaid from property taxes.
FY2019 Debt Service Costs
As shown in the table below, FY2019 includes total appropriations of approximately $607 million for alternate bonds, CIT Bonds, and PBC payments.
CPS is required to set aside debt service a year in advance for EBF-funded debt and one-and-a-half years in advance for PPRT and CIT bond-funded debt service. These payments are held in trust with an independent trustee, as required by the bond indentures. PPRT, used to pay Alternate Revenue bonds, is deposited directly from the State to a trustee; and the capital improvement tax levy, used to pay CIT bonds, is deposited directly from Cook County to a trustee. Therefore, the FY2019 revenues shown for the Debt Service Funds represent the amount that is to be set aside for these future debt payments.
Because of this set-aside requirement, the majority of the appropriations for FY2019 represent the amount that is to be paid from revenues set aside in the prior year. Table 1 provides information on the debt service fund balance at the beginning of the year, the expenditures that are made from the debt service fund, and the revenues that largely fund the debt service requirements for the following fiscal year.
| FY2017 | FY2018 | FY2019 | |
|---|---|---|---|
| Actual | Estimated | Budget | |
| Beginning Fund Balance | 469.3 | 577.2 | 841.1 |
| Revenues: | |||
| Property Taxes | 52.7 | 52.5 | 30.6 |
| PPRT | 58.3 | 58.3 | 34.9 |
| EBF | 391.0 | 323.4 | 328.0 |
| Federal Interest Subsidy | 25.0 | 25.0 | 24.7 |
| Other Local (City IGA and Net of Interest Earnings) | 100.2 | 107.2 | 112.5 |
| CIT | - | 43.7 | 50.5 |
| Total Revenue | 629.2 | 610.1 | 581.3 |
| Expenses: | |||
| Existing Bond Principal payment | 152.7 | 137.4 | 154.7 |
| Existing Bond Interest payment | 375.8 | 379.2 | 450.0 |
| Fees | 2.6 | 15.8 | 7.5 |
| Total Existing Bond Debt Service | 531.0 | 532.4 | 611.9 |
| Other Financing Sources | |||
| Net Amounts from Debt Issuances | 68.0 | 463.4 | 21.0 |
| Transfers in /(out) | (58.3) | (277.2) | (17.5) |
| Total other Financing Sources /(Uses) | 9.7 | 186.2 | 3.5 |
| Ending Fund Balance | 577.2 | 841.1 | 814.0 |
Future Debt Service Profile
The following graph illustrates the fiscal challenges of CPS’ debt obligations on currently outstanding bonds as of June 30, 2018. This graph does not show the impact of any future bonds required to support future capital budgets or debt restructuring.
Chart 2: CPS Debt Service Funding Schedule
(as of June 30, 2018)
(in Thousands)
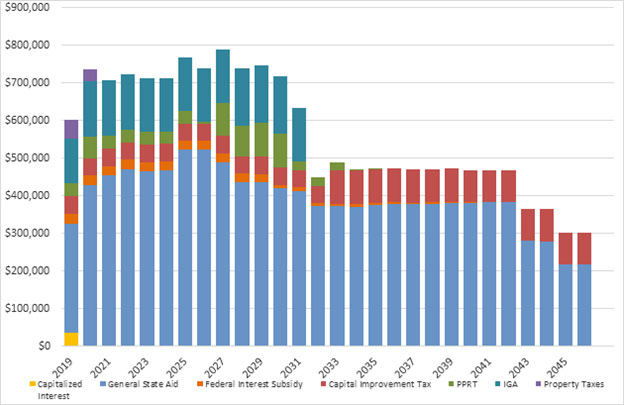
*Does not include future long-term bond financings or current and future short-term financings.
Measuring Debt Burden
External stakeholders such as taxpayers, employees, parents, government watchdog groups, rating agencies, and bondholders frequently review CPS’ debt profile to gauge its size and structure as a crucial component of CPS’ financial position. In addition to evaluating the total amount of debt outstanding and the annual debt service payments, those evaluating CPS’ financial picture also look at the “debt burden.” The purpose is to gauge how much taxpayers bear in debt costs and determine how much debt is affordable for residents, which establishes true debt capacity. Several methods of measuring debt burden are commonly employed for school districts, including comparing existing debt to legal debt limits, measuring debt per capita and measuring debt as a percentage of operating expenditures.
Legal Debt Limit
The Illinois School Code imposes a statutory limit of 13.8 percent on the ratio of the total outstanding property tax-supported debt that a school district may borrow compared with a school district’s equalized assessed value, which generally represents a fraction of total property value in the district. Because the Board has issued alternate revenue bonds for which property tax levies are not extended, these bonds do not count against the legal debt limit imposed by the Illinois School Code. Therefore, total property tax supported debt is extremely low, at less than 1 percent of the legal debt limit.
Debt Per Capita
The Board’s per capita debt burden, or total debt divided by the City of Chicago’s population, has increased in the last decade. As reported in the FY2017 Comprehensive Annual Financial Report, General Obligation debt per capita is $2,670. This is still considered moderate to slightly above average relative to other comparable school districts.
A copy of the Debt Management Policy is available at the Board’s website at http://policy.cps.k12.il.us/download.aspx?ID=42
| Description | Closing Date | Maturity Date | Principal Outstanding | Pledged Funding Source for Debt Service |
|---|---|---|---|---|
| PBC Series A of 1992 | 1/1/92 | 1/1/20 | 53,800,000 | Property Tax |
| PBC Series B of 1999 | 3/1/99 | 12/1/18 | 19,720,000 | Property Tax |
| ULT GO Series 1998B-1* | 10/28/98 | 12/1/31 | 232,380,062 | IGA/PPRT |
| ULT GO Series 1999A* | 2/25/99 | 12/1/31 | 361,199,753 | IGA/PPRT |
| ULT GO Refunding, Series 2004A | 4/6/04 | 12/1/20 | 49,600,000 | PPRT/EBF |
| ULT GO Series 2005A | 6/27/05 | 12/1/32 | 159,825,000 | PPRT/EBF |
| QZAB Series 2006A | 6/7/06 | 6/1/21 | 6,852,800 | EBF |
| ULT GO Series 2006B | 9/27/06 | 12/1/36 | 22,005,000 | EBF |
| ULT GO Series 2007B | 9/4/07 | 12/1/24 | 16,035,000 | IGA/PPRT |
| ULT GO Series 2008A | 5/13/08 | 12/1/30 | 262,785,000 | IGA/PPRT |
| ULT GO Series 2008B | 5/13/08 | 3/1/34 | 169,425,000 | EBF |
| ULT GO Series 2008C | 5/1/08 | 12/1/32 | 450,250,000 | EBF |
| ULT GO Series 2009D | 7/29/09 | 12/1/22 | 21,910,000 | EBF |
| ULT GO BAB Series 2009E | 9/24/09 | 12/1/39 | 504,430,000 | EBF/Fed Subsidy |
| ULT GO QSCB Series 2009G** | 12/17/09 | 12/15/25 | 254,240,000 | EBF/Fed Subsidy |
| ULT GO QSCB Series 2010C | 11/2/10 | 11/1/29 | 257,125,000 | EBF/Fed Subsidy |
| ULT GO BAB Series 2010D | 11/2/10 | 12/1/40 | 125,000,000 | EBF/Fed Subsidy |
| ULT GO Refunding Series 2010F | 11/2/10 | 12/1/31 | 144,985,000 | EBF |
| ULT GO Series 2011A | 11/1/11 | 12/1/41 | 402,410,000 | EBF |
| ULT GO Series 2012A | 8/21/12 | 12/1/42 | 468,915,000 | EBF |
| ULT GO Series 2012B | 12/21/12 | 12/1/35 | 109,825,000 | EBF |
| ULT GO Series 2015CE | 4/29/15 | 12/1/39 | 300,000,000 | EBF |
| ULT GO Series 2016A | 2/8/16 | 12/1/44 | 725,000,000 | EBF |
| ULT GO Series 2016B | 7/29/16 | 12/1/46 | 150,000,000 | EBF |
| CIT Series 2016 | 1/4/17 | 4/1/46 | 729,580,000 | CIT |
| CIT Series 2017 | 11/30/17 | 4/1/46 | 64,900,000 | CIT |
| ULT GO Series 2017A | 6/13/17 | 12/1/46 | 285,000,000 | EBF |
| ULT GO Series 2017B | 6/13/17 | 12/1/42 | 215,000,000 | EBF |
| ULT GO Series 2017C | 11/30/17 | 12/1/34 | 351,485,000 | EBF |
| ULT GO Series 2017D | 11/30/17 | 12/1/31 | 79,325,000 | EBF |
| ULT GO Series 2017E | 11/30/17 | 12/1/21 | 22,180,000 | PPRT |
| ULT GO Series 2017F | 11/30/17 | 12/1/24 | 165,510,000 | IGA |
| ULT GO Series 2017G | 11/30/17 | 12/1/44 | 126,500,000 | PPRT/EBF |
| ULT GO Series 2017H | 11/30/17 | 12/1/46 | 280,000,000 | PPRT/EBF/IGA |
| ULT GO Series 2018A | 6/1/18 | 12/1/35 | 552,030,000 | EBF |
| ULT GO Series 2018B | 6/1/18 | 12/1/22 | 10,220,000 | EBF |
| Total Principal Outstanding | $8,149,447,615 |
| Description | Closing Date | Maturity Date | Principal Outstanding | Pledged Funding Source for Debt Service |
|---|---|---|---|---|
| Tax Anticipation Notes, Series 2017E | 1/5/2018 | 12/15/2018* | 202,635,000 | Ed Fund Property Tax |
| Tax Anticipation Notes, Series 2017F | 1/5/2018 | 12/15/2018* | 147,365,000 | Ed Fund Property Tax |
| Tax Anticipation Notes, Series 2017G | 2/16/2018 | 12/15/2018* | 144,700,000 | Ed Fund Property Tax |
| Tax Anticipation Notes, Series 2017H | 11/10/2016 | 12/15/2018* | 105,300,000 | Ed Fund Property Tax |
| Total Principal Outstanding | $600,000,000 |
*The maturity date of the 2017EFGH TANs is the earlier of (A) December 15, 2018 or (B) (1) September 30, 2018, if the Tax Penalty Date is on or prior to August 1, 2018 or (2) the 60th day following the Tax Penalty Date, if the Tax Penalty Date is later than August 1, 2018.
| Fiscal Year ending June 30 | Total Existing General Obligation Bond Principal | Total Existing General Obligation Bond Interest | Total Existing G.O. Bond Debt Service | Total Existing G.O PBC Leases | TOTAL |
|---|---|---|---|---|---|
| 2019 | 144,035 | 311,086 | 455,121 | 30,636 | 485,757 |
| 2020 | 226,131 | 427,299 | 653,430 | 653,430 | |
| 2021 | 230,726 | 424,372 | 655,098 | 655,098 | |
| 2022 | 254,183 | 418,305 | 672,488 | 672,488 | |
| 2023 | 259,687 | 406,869 | 666,556 | 666,556 | |
| 2024 | 269,033 | 398,257 | 667,290 | 667,290 | |
| 2025 | 333,524 | 388,549 | 722,073 | 722,073 | |
| 2026 | 318,456 | 372,964 | 691,420 | 691,420 | |
| 2027 | 322,053 | 420,736 | 742,789 | 742,789 | |
| 2028 | 289,499 | 392,524 | 682,023 | 682,023 | |
| 2029 | 300,583 | 390,160 | 690,743 | 690,743 | |
| 2030 | 287,971 | 373,847 | 661,818 | 661,818 | |
| 2031 | 264,231 | 321,771 | 586,002 | 586,002 | |
| 2032 | 196,045 | 205,885 | 401,930 | 401,930 | |
| 2033 | 205,870 | 195,286 | 401,156 | 401,156 | |
| 2034 | 195,005 | 186,645 | 381,650 | 381,650 | |
| 2035 | 211,140 | 173,476 | 384,616 | 384,616 | |
| 2036 | 223,290 | 159,864 | 383,154 | 383,154 | |
| 2037 | 232,370 | 149,940 | 382,310 | 382,310 | |
| 2038 | 246,265 | 136,407 | 382,672 | 382,672 | |
| 2039 | 260,930 | 122,050 | 382,980 | 382,980 | |
| 2040 | 276,830 | 106,965 | 383,795 | 383,795 | |
| 2041 | 293,675 | 90,125 | 383,800 | 383,800 | |
| 2042 | 311,030 | 73,160 | 384,190 | 384,190 | |
| 2043 | 225,175 | 55,293 | 280,468 | 280,468 | |
| 2044 | 238,790 | 40,775 | 279,565 | 279,565 | |
| 2045 | 192,270 | 25,355 | 217,625 | 217,625 | |
| 2046 | 204,630 | 13,078 | 217,708 | 217,708 | |
| 2047 | |||||
| TOTAL | 7,013,427 | 6,781,389 | 13,794,470 | 30,636 | 13,825,106 |
*Table is based on budgeted debt service requirements to be deposited within each fiscal year. Excludes issues completed after June 30, 2018 and any future anticipated transactions which were included in the FY2019 budget.
| Fiscal Year ending June 30 | Total Existing CIT Bond Principal | Total Existing CIT Bond Interest | TOTAL |
|---|---|---|---|
| 2019 | 46,784 | 46,784 | |
| 2020 | 46,784 | 46,784 | |
| 2021 | 46,784 | 46,784 | |
| 2022 | 46,784 | 46,784 | |
| 2023 | 46,784 | 46,784 | |
| 2024 | 46,784 | 46,784 | |
| 2025 | 46,784 | 46,784 | |
| 2026 | 46,784 | 46,784 | |
| 2027 | 46,784 | 46,784 | |
| 2028 | 46,784 | 46,784 | |
| 2029 | 46,784 | 46,784 | |
| 2030 | 46,784 | 46,784 | |
| 2031 | 46,784 | 46,784 | |
| 2032 | 46,784 | 46,784 | |
| 2033 | 38,225 | 50,094 | 88,319 |
| 2034 | 40,395 | 48,086 | 88,481 |
| 2035 | 42,695 | 45,964 | 88,569 |
| 2036 | 45,125 | 43,721 | 88,846 |
| 2037 | 47,835 | 41,202 | 89,038 |
| 2038 | 50,660 | 38,571 | 89,231 |
| 2039 | 53,660 | 35,789 | 89,449 |
| 2040 | 56,835 | 28,174 | 85,009 |
| 2041 | 60,200 | 24,810 | 85,010 |
| 2042 | 63,760 | 21,247 | 85,007 |
| 2043 | 71,535 | 17,473 | 85,008 |
| 2044 | 71,535 | 13,475 | 85,010 |
| 2045 | 75,765 | 9,240 | 85,005 |
| 2046 | 80,255 | 4,753 | 85,008 |
| TOTAL | 794,480 | 1,077,575 | 1,872,055 |
*Excludes issues completed after June 30, 2018 and any future anticipated transactions which were included in the FY2019 budget.